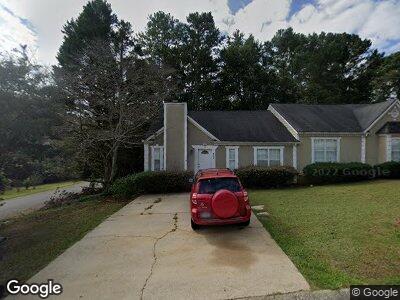
4030 Settlers Hill Way Norcross, GA 30093
Estimated Value: $219,000 - $254,000
3
Beds
2
Baths
1,056
Sq Ft
$224/Sq Ft
Est. Value
About This Home
This home is located at 4030 Settlers Hill Way, Norcross, GA 30093 and is currently estimated at $236,195, approximately $223 per square foot. 4030 Settlers Hill Way is a home located in Gwinnett County with nearby schools including Minor Elementary School, Berkmar Middle School, and Berkmar High School.
Ownership History
Date
Name
Owned For
Owner Type
Purchase Details
Closed on
Apr 19, 2011
Sold by
Hud & Housing Of Urban Dev
Bought by
Velasco William A
Current Estimated Value
Purchase Details
Closed on
Apr 6, 2010
Sold by
Bac Hm Lns Svcng Lp
Bought by
Hud-Housing Of Urban Dev
Purchase Details
Closed on
Jul 31, 2007
Sold by
Mckenzie M Mundy
Bought by
Jimenez Baldomero and Martinez Alma
Home Financials for this Owner
Home Financials are based on the most recent Mortgage that was taken out on this home.
Original Mortgage
$108,792
Interest Rate
6.65%
Mortgage Type
FHA
Purchase Details
Closed on
Apr 17, 1998
Sold by
Day Marsha H
Bought by
Mckenzie M Mundy
Home Financials for this Owner
Home Financials are based on the most recent Mortgage that was taken out on this home.
Original Mortgage
$75,000
Interest Rate
7.09%
Mortgage Type
New Conventional
Create a Home Valuation Report for This Property
The Home Valuation Report is an in-depth analysis detailing your home's value as well as a comparison with similar homes in the area
Home Values in the Area
Average Home Value in this Area
Purchase History
| Date | Buyer | Sale Price | Title Company |
|---|---|---|---|
| Velasco William A | $27,700 | -- | |
| Hud-Housing Of Urban Dev | -- | -- | |
| Bac Home Loans Servicing Lp | $112,903 | -- | |
| Jimenez Baldomero | $110,500 | -- | |
| Mckenzie M Mundy | $81,500 | -- |
Source: Public Records
Mortgage History
| Date | Status | Borrower | Loan Amount |
|---|---|---|---|
| Previous Owner | Jimenez Baldomero | $108,792 | |
| Previous Owner | Mckenize M Mundy | $12,000 | |
| Previous Owner | Mckenzie M Mundy | $75,000 |
Source: Public Records
Tax History Compared to Growth
Tax History
| Year | Tax Paid | Tax Assessment Tax Assessment Total Assessment is a certain percentage of the fair market value that is determined by local assessors to be the total taxable value of land and additions on the property. | Land | Improvement |
|---|---|---|---|---|
| 2023 | $3,313 | $75,280 | $14,000 | $61,280 |
| 2022 | $2,696 | $67,880 | $12,000 | $55,880 |
| 2021 | $2,100 | $50,560 | $9,600 | $40,960 |
| 2020 | $1,989 | $47,240 | $7,840 | $39,400 |
| 2019 | $1,919 | $47,240 | $7,840 | $39,400 |
| 2018 | $1,512 | $35,760 | $7,200 | $28,560 |
| 2016 | $1,385 | $31,600 | $7,200 | $24,400 |
| 2015 | $923 | $18,240 | $4,400 | $13,840 |
| 2014 | $926 | $18,240 | $4,400 | $13,840 |
Source: Public Records
Map
Nearby Homes
- 858 Heritage Valley Rd
- 4049 Heritage Valley Ct
- 4120 Buckley Woods Dr
- 4081 Liberty Hill Dr
- 1041 Heritage Valley Rd
- 3826 Green Bay Dr Unit 2
- 1048 Tumblewood Trail
- 1287 Peninsula Trace
- 959 Hampton Trail NW
- 3657 Willow Wood Way
- 933 Carla Place
- 929 Hampton Trail NW
- 3945 Peninsula Ct
- 1358 Millstream Trail
- 3871 Pleasant Oaks Dr Unit 59
- 3835 Pleasant Oaks Dr
- 4076 Shady Cir NW
- 1427 Peninsula Trace
- 4042 Shady Cir NW
- 4030 Settlers Hill Way
- 4032 Settlers Hill Way
- 4050 Settlers Hill Way
- 1152 Overland Hill Trace
- 4012 Settlers Hill Way
- 4052 Settlers Hill Way
- 1150 Overland Hill Trace
- 0 Settlers Hill Way Unit 7303358
- 0 Settlers Hill Way Unit 3145850
- 0 Settlers Hill Way Unit 3260528
- 0 Settlers Hill Way Unit 8161711
- 0 Settlers Hill Way Unit 3284876
- 0 Settlers Hill Way Unit 8823014
- 0 Settlers Hill Way Unit 8670924
- 0 Settlers Hill Way Unit 8554557
- 0 Settlers Hill Way Unit 8480242
- 0 Settlers Hill Way Unit 8184305
- 0 Settlers Hill Way Unit 8120462
- 0 Settlers Hill Way Unit 8139635
- 0 Settlers Hill Way Unit 7462820