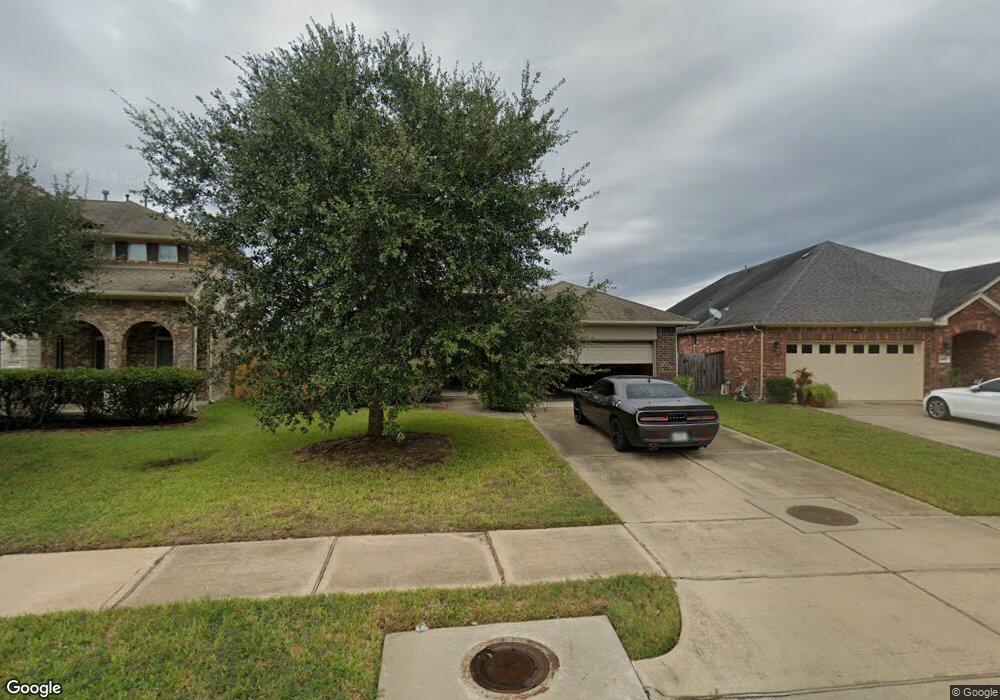
4031 Addison Ranch Drive Ln Fulshear, TX 77441
Estimated Value: $361,554 - $420,000
3
Beds
2
Baths
1,874
Sq Ft
$211/Sq Ft
Est. Value
About This Home
This home is located at 4031 Addison Ranch Drive Ln, Fulshear, TX 77441 and is currently estimated at $395,139, approximately $210 per square foot. 4031 Addison Ranch Drive Ln is a home located in Fort Bend County with nearby schools including Campbell Elementary School, Joe M. Adams Junior High, and Sugar Creek Montessori - Fulshear/West Katy.
Ownership History
Date
Name
Owned For
Owner Type
Purchase Details
Closed on
Jun 19, 2014
Sold by
Taylor Morrison Of Texas Inc
Bought by
Wagner Gregory P and Sanchez Christina
Current Estimated Value
Home Financials for this Owner
Home Financials are based on the most recent Mortgage that was taken out on this home.
Original Mortgage
$168,354
Outstanding Balance
$128,390
Interest Rate
4.27%
Mortgage Type
New Conventional
Estimated Equity
$266,749
Purchase Details
Closed on
Jul 17, 2013
Sold by
Beazer Homes Texas Lp
Bought by
Wagner Gregory P and Christina Sanchez
Purchase Details
Closed on
Apr 10, 2013
Sold by
Beazer Homes Texas Lp
Bought by
Wagner Gregory P and Christina Sanchez
Create a Home Valuation Report for This Property
The Home Valuation Report is an in-depth analysis detailing your home's value as well as a comparison with similar homes in the area
Home Values in the Area
Average Home Value in this Area
Purchase History
| Date | Buyer | Sale Price | Title Company |
|---|---|---|---|
| Wagner Gregory P | -- | Advantage Title Of Ft Bend | |
| Wagner Gregory P | -- | -- | |
| Wagner Gregory P | -- | -- |
Source: Public Records
Mortgage History
| Date | Status | Borrower | Loan Amount |
|---|---|---|---|
| Open | Wagner Gregory P | $168,354 |
Source: Public Records
Tax History Compared to Growth
Tax History
| Year | Tax Paid | Tax Assessment Tax Assessment Total Assessment is a certain percentage of the fair market value that is determined by local assessors to be the total taxable value of land and additions on the property. | Land | Improvement |
|---|---|---|---|---|
| 2025 | $9,064 | $332,249 | $69,615 | $262,634 |
| 2024 | $9,064 | $373,360 | $69,615 | $303,745 |
| 2023 | $8,585 | $344,238 | $53,550 | $290,688 |
| 2022 | $8,451 | $303,660 | $53,550 | $250,110 |
| 2021 | $6,243 | $217,170 | $53,550 | $163,620 |
| 2020 | $6,456 | $220,190 | $42,840 | $177,350 |
| 2019 | $7,020 | $224,240 | $42,840 | $181,400 |
| 2018 | $6,779 | $216,180 | $42,840 | $173,340 |
| 2017 | $6,794 | $216,340 | $42,840 | $173,500 |
| 2016 | $7,303 | $232,520 | $42,840 | $189,680 |
| 2015 | $4,749 | $225,870 | $42,840 | $183,030 |
| 2014 | $549 | $26,000 | $26,000 | $0 |
Source: Public Records
Map
Nearby Homes
- 4110 Addison Ranch Ln
- 27514 Wilson Run Ln
- 4218 Brannon Branch Ct
- 27603 Huggins Crest Ct
- 27410 Ashland Meadow Ln
- 27415 Royal Canyon Ln
- 27414 Wooded Canyon Dr
- 27419 Canyon Reach Dr
- 27411 Canyon Reach Dr
- 27423 Sunrise Ranch Ln
- 28807 Mayes Bluff Dr
- 28131 Twin Knolls Ln
- 4314 Kent Ranch Ct
- 4943 Ginger Bluff Trail
- 3422 Walker Falls Ln
- 3438 Cartwright Cliff Ln
- 3710 Meadowmist Ct
- 4834 Sequoia Park Ln
- 28707 Hemlock Red Ct
- 28723 Primrose Bluff Dr
- 4027 Addison Ranch Ln
- 4103 Addison Ranch Ln
- 4031 Addison Ranch Ln
- 4107 Addison Ranch Ln
- 4023 Addison Ranch Ln
- 4111 Addison Ranch Ln
- 4019 Addison Ranch Ln
- 4106 Addison Ranch Ln
- 4102 Addison Ranch Ln
- 4018 Addison Ranch Ln
- 4015 Addison Ranch Ln
- 4115 Addison Ranch Ln
- 4014 Addison Ranch Ln
- 4011 Addison Ranch Ln
- 4119 Addison Ranch Ln
- 4010 Addison Ranch Ln
- 4107 Churchill Place Ct
- 4103 Churchill Place Ct
- 4006 Addison Ranch Ln
- 4114 Addison Ranch Ln