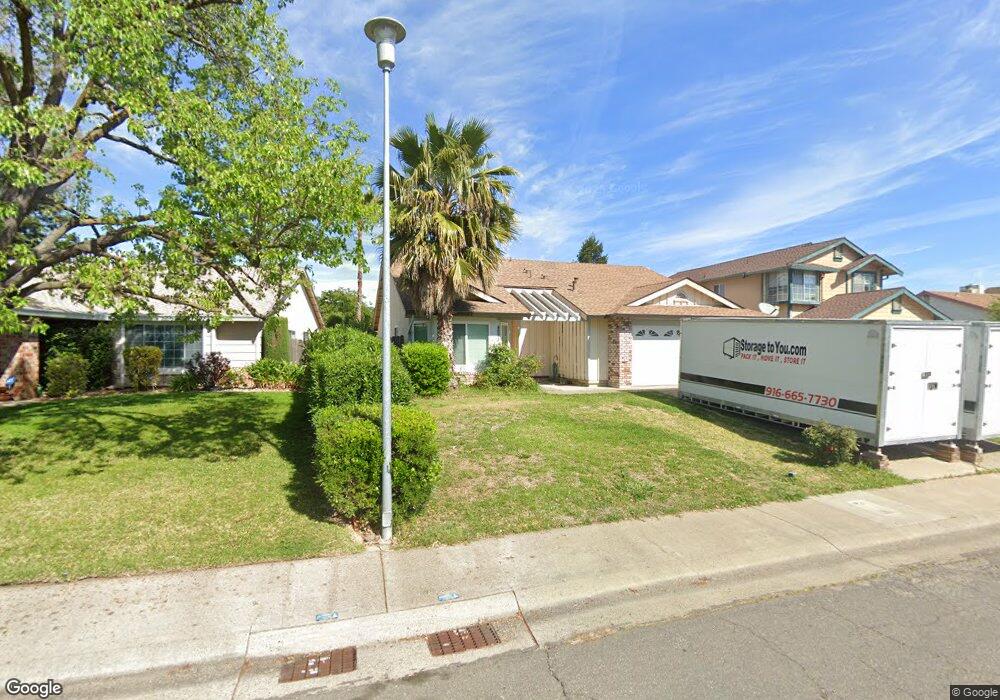
4031 Evalita Way Sacramento, CA 95823
North Laguna NeighborhoodEstimated Value: $382,000 - $465,000
3
Beds
2
Baths
1,438
Sq Ft
$304/Sq Ft
Est. Value
About This Home
This home is located at 4031 Evalita Way, Sacramento, CA 95823 and is currently estimated at $437,563, approximately $304 per square foot. 4031 Evalita Way is a home located in Sacramento County with nearby schools including Union House Elementary School, Samuel Jackman Middle School, and Valley High School.
Ownership History
Date
Name
Owned For
Owner Type
Purchase Details
Closed on
Jan 14, 2003
Sold by
Bennett John
Bought by
Bennett John and Roberts Bennett Loretta
Current Estimated Value
Home Financials for this Owner
Home Financials are based on the most recent Mortgage that was taken out on this home.
Original Mortgage
$192,479
Outstanding Balance
$81,755
Interest Rate
5.96%
Mortgage Type
FHA
Estimated Equity
$355,808
Purchase Details
Closed on
Dec 31, 2002
Sold by
Singh Deepak A
Bought by
Bennett John
Home Financials for this Owner
Home Financials are based on the most recent Mortgage that was taken out on this home.
Original Mortgage
$192,479
Outstanding Balance
$81,755
Interest Rate
5.96%
Mortgage Type
FHA
Estimated Equity
$355,808
Purchase Details
Closed on
Nov 22, 2000
Sold by
Schultz Louann
Bought by
Singh Deepak A
Home Financials for this Owner
Home Financials are based on the most recent Mortgage that was taken out on this home.
Original Mortgage
$115,600
Interest Rate
7.86%
Create a Home Valuation Report for This Property
The Home Valuation Report is an in-depth analysis detailing your home's value as well as a comparison with similar homes in the area
Home Values in the Area
Average Home Value in this Area
Purchase History
| Date | Buyer | Sale Price | Title Company |
|---|---|---|---|
| Bennett John | -- | -- | |
| Bennett John | $195,500 | Alliance Title Company | |
| Bennett John | -- | Alliance Title Company | |
| Singh Deepak A | -- | Financial Title Company | |
| Singh Deepak A | -- | Financial Title Company |
Source: Public Records
Mortgage History
| Date | Status | Borrower | Loan Amount |
|---|---|---|---|
| Open | Bennett John | $192,479 | |
| Previous Owner | Singh Deepak A | $115,600 | |
| Closed | Bennett John | $11,730 |
Source: Public Records
Tax History Compared to Growth
Tax History
| Year | Tax Paid | Tax Assessment Tax Assessment Total Assessment is a certain percentage of the fair market value that is determined by local assessors to be the total taxable value of land and additions on the property. | Land | Improvement |
|---|---|---|---|---|
| 2025 | $4,260 | $283,122 | $72,401 | $210,721 |
| 2024 | $4,260 | $277,572 | $70,982 | $206,590 |
| 2023 | $3,230 | $272,131 | $69,591 | $202,540 |
| 2022 | $3,187 | $266,796 | $68,227 | $198,569 |
| 2021 | $3,139 | $261,566 | $66,890 | $194,676 |
| 2020 | $3,091 | $258,885 | $66,205 | $192,680 |
| 2019 | $3,942 | $253,809 | $64,907 | $188,902 |
| 2018 | $4,628 | $248,834 | $63,635 | $185,199 |
| 2017 | $3,897 | $243,956 | $62,388 | $181,568 |
| 2016 | $2,669 | $239,173 | $61,165 | $178,008 |
| 2015 | $2,409 | $215,489 | $55,110 | $160,379 |
| 2014 | $3,536 | $197,697 | $50,560 | $147,137 |
Source: Public Records
Map
Nearby Homes
- 4175 Amapola Way
- 4370 Armadale Way
- 7895 Ann Arbor Way
- 8044 Torrente Way
- 4105 Deerbrook Dr
- 7844 Deerglen Way
- 7843 Deer Creek Dr
- 4515 Montril Way
- 8110 Torrente Way
- 7829 Acorri Walk
- 7864 Monaldo Walk
- 240 Summer Stroll Cir
- 7835 Zaragoza Walk
- 7839 Brizio Walk
- 3950 Mack Rd Unit 66
- 3950 Mack Rd Unit 169
- 3950 Mack Rd Unit 129
- 3950 Mack Rd Unit 182
- 4790 Valley hi Dr
- 4865 Lion Gate Way
- 4039 Evalita Way
- 4023 Evalita Way
- 4047 Evalita Way
- 4016 La Tarriga Way
- 4024 La Tarriga Way
- 4015 Evalita Way
- 4032 La Tarriga Way
- 4008 La Tarriga Way
- 4038 Evalita Way
- 4030 Evalita Way
- 4055 Evalita Way
- 4046 Evalita Way
- 4040 La Tarriga Way
- 4022 Evalita Way
- 4054 Evalita Way
- 4063 Evalita Way
- 4048 La Tarriga Way
- 4014 Evalita Way
- 4062 Evalita Way
- 4019 La Tarriga Way