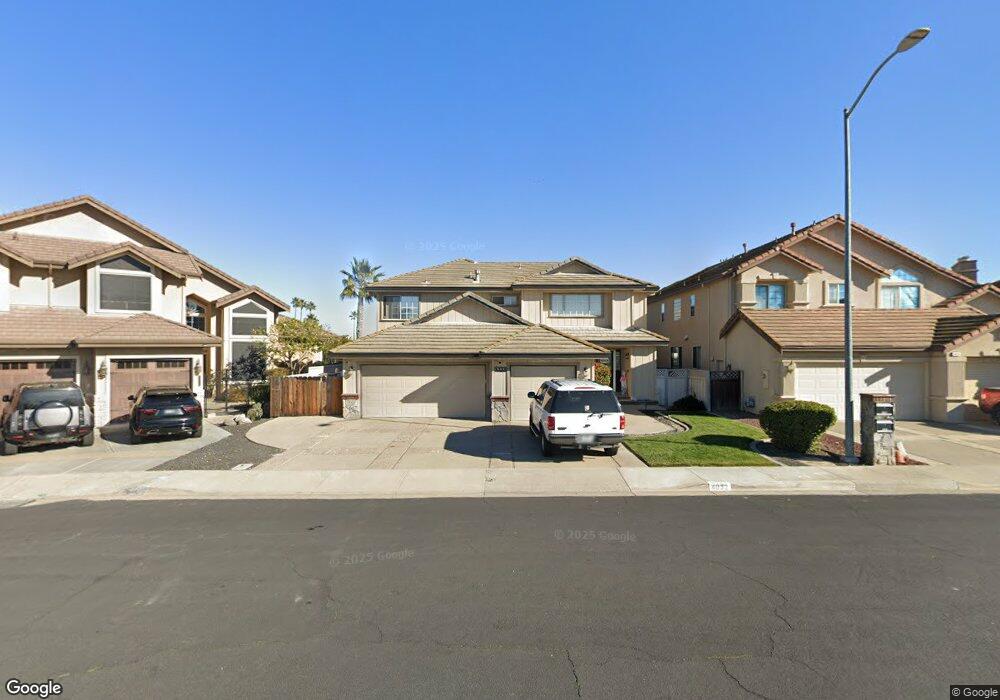
4032 Capstan Place Discovery Bay, CA 94505
Estimated Value: $1,085,582 - $1,372,000
4
Beds
3
Baths
3,223
Sq Ft
$379/Sq Ft
Est. Value
About This Home
This home is located at 4032 Capstan Place, Discovery Bay, CA 94505 and is currently estimated at $1,221,896, approximately $379 per square foot. 4032 Capstan Place is a home located in Contra Costa County with nearby schools including Timber Point Elementary School, Excelsior Middle School, and Liberty High School.
Ownership History
Date
Name
Owned For
Owner Type
Purchase Details
Closed on
May 10, 2017
Sold by
Claypool Anita Marlene
Bought by
Conley James M and Conley Patricia D
Current Estimated Value
Home Financials for this Owner
Home Financials are based on the most recent Mortgage that was taken out on this home.
Original Mortgage
$636,150
Outstanding Balance
$529,617
Interest Rate
4.14%
Mortgage Type
New Conventional
Estimated Equity
$692,279
Purchase Details
Closed on
Jun 16, 1999
Sold by
Eck Paul R and Eck Barbara L
Bought by
Eck Paul R and Eck Barbara L
Purchase Details
Closed on
Jun 7, 1994
Sold by
Robert Martinson Construction Inc
Bought by
Eck Paul R and Eck Barbara L
Home Financials for this Owner
Home Financials are based on the most recent Mortgage that was taken out on this home.
Original Mortgage
$225,000
Interest Rate
8.35%
Mortgage Type
Purchase Money Mortgage
Create a Home Valuation Report for This Property
The Home Valuation Report is an in-depth analysis detailing your home's value as well as a comparison with similar homes in the area
Home Values in the Area
Average Home Value in this Area
Purchase History
| Date | Buyer | Sale Price | Title Company |
|---|---|---|---|
| Conley James M | $820,000 | Fidelity National Title Co | |
| Eck Paul R | -- | -- | |
| Eck Paul R | $416,000 | Commonwealth Land Title Ins |
Source: Public Records
Mortgage History
| Date | Status | Borrower | Loan Amount |
|---|---|---|---|
| Open | Conley James M | $636,150 | |
| Previous Owner | Eck Paul R | $225,000 |
Source: Public Records
Tax History
| Year | Tax Paid | Tax Assessment Tax Assessment Total Assessment is a certain percentage of the fair market value that is determined by local assessors to be the total taxable value of land and additions on the property. | Land | Improvement |
|---|---|---|---|---|
| 2025 | $12,130 | $951,675 | $382,991 | $568,684 |
| 2024 | $11,584 | $933,016 | $375,482 | $557,534 |
| 2023 | $11,413 | $914,722 | $368,120 | $546,602 |
| 2022 | $11,234 | $896,787 | $360,902 | $535,885 |
| 2021 | $10,973 | $879,204 | $353,826 | $525,378 |
| 2019 | $14,045 | $853,128 | $343,332 | $509,796 |
| 2018 | $13,640 | $836,400 | $336,600 | $499,800 |
| 2017 | $2,787 | $132,274 | $42,223 | $90,051 |
| 2016 | $2,987 | $129,682 | $41,396 | $88,286 |
| 2015 | $2,844 | $127,735 | $40,775 | $86,960 |
| 2014 | $2,775 | $125,234 | $39,977 | $85,257 |
Source: Public Records
Map
Nearby Homes
- 2008 Windward Point
- 91 Shell Place
- 1963 Windward Point
- 4010 Goleta Place
- 2027 Windward Point
- 4105 Windward Ct
- 1944 Windward Point
- 2218 Newport Ct
- 2265 Newport Ct
- 2236 Newport Ct
- 1933 Windward Point
- 2337 Newport Place S
- 1989 Newport Dr
- 3982 Bolinas Place
- 1864 Dune Point Way
- 3973 Bolinas Place
- 2293 Reef Ct
- 3681 Yacht Dr
- 4621 Clipper Dr
- 2459 Del Mar Ct
- 4028 Capstan Place
- 4024 Capstan Place
- 4031 Capstan Place
- 4020 Capstan Place
- 4023 Capstan Place
- 4019 Capstan Place
- 4016 Capstan Place
- 4015 Capstan Place
- 4012 Capstan Place
- 4011 Capstan Place
- 4008 Capstan Place
- 1980 Windward Point
- 1976 Windward Point
- 4007 Capstan Place
- 1984 Windward Point
- 1972 Windward Point
- 1988 Windward Point
- 1968 Windward Point
- 1992 Windward Point
- 4004 Capstan Place
Your Personal Tour Guide
Ask me questions while you tour the home.