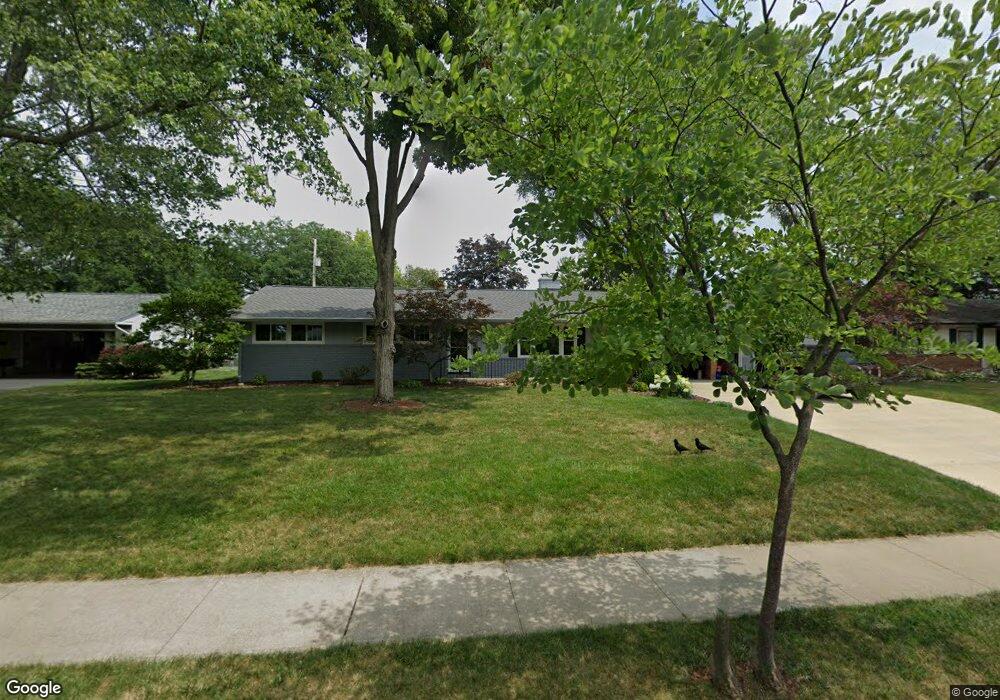
4032 Mountview Rd Columbus, OH 43220
Estimated Value: $519,806 - $859,000
3
Beds
3
Baths
1,526
Sq Ft
$411/Sq Ft
Est. Value
About This Home
This home is located at 4032 Mountview Rd, Columbus, OH 43220 and is currently estimated at $626,702, approximately $410 per square foot. 4032 Mountview Rd is a home located in Franklin County with nearby schools including Windermere Elementary School, Hastings Middle School, and Upper Arlington High School.
Ownership History
Date
Name
Owned For
Owner Type
Purchase Details
Closed on
Jan 29, 2010
Sold by
Spillman Anne C and Spillman Raymond H
Bought by
Sumner Ann Louise
Current Estimated Value
Home Financials for this Owner
Home Financials are based on the most recent Mortgage that was taken out on this home.
Original Mortgage
$220,424
Outstanding Balance
$142,383
Interest Rate
4.87%
Mortgage Type
FHA
Estimated Equity
$484,319
Purchase Details
Closed on
Apr 4, 2008
Sold by
Spillman Anne C and Spillman Raymond H
Bought by
Spillman Anne C and Spillman Raymond H
Purchase Details
Closed on
Sep 2, 2005
Sold by
Estate Of Betty Jean Puglisi
Bought by
Puglisi Anthony S
Purchase Details
Closed on
Jul 27, 1965
Bought by
Puglisi Anthony S
Create a Home Valuation Report for This Property
The Home Valuation Report is an in-depth analysis detailing your home's value as well as a comparison with similar homes in the area
Home Values in the Area
Average Home Value in this Area
Purchase History
| Date | Buyer | Sale Price | Title Company |
|---|---|---|---|
| Sumner Ann Louise | $224,600 | Real Living | |
| Spillman Anne C | -- | Attorney | |
| Spillman Anne C | $96,000 | Attorney | |
| Puglisi Anthony S | -- | -- | |
| Puglisi Anthony S | -- | -- |
Source: Public Records
Mortgage History
| Date | Status | Borrower | Loan Amount |
|---|---|---|---|
| Open | Sumner Ann Louise | $220,424 |
Source: Public Records
Tax History
| Year | Tax Paid | Tax Assessment Tax Assessment Total Assessment is a certain percentage of the fair market value that is determined by local assessors to be the total taxable value of land and additions on the property. | Land | Improvement |
|---|---|---|---|---|
| 2025 | $9,376 | $161,950 | $73,920 | $88,030 |
| 2024 | $9,376 | $161,950 | $73,920 | $88,030 |
| 2023 | $9,260 | $161,950 | $73,920 | $88,030 |
| 2022 | $7,729 | $110,610 | $50,090 | $60,520 |
| 2021 | $6,842 | $110,610 | $50,090 | $60,520 |
| 2020 | $6,781 | $110,610 | $50,090 | $60,520 |
| 2019 | $6,452 | $93,040 | $50,090 | $42,950 |
| 2018 | $5,877 | $93,040 | $50,090 | $42,950 |
| 2017 | $6,402 | $93,040 | $50,090 | $42,950 |
| 2016 | $5,344 | $80,820 | $32,410 | $48,410 |
| 2015 | $5,339 | $80,820 | $32,410 | $48,410 |
| 2014 | $5,345 | $80,820 | $32,410 | $48,410 |
| 2013 | $2,552 | $73,465 | $29,470 | $43,995 |
Source: Public Records
Map
Nearby Homes
- 2200 Nayland Rd
- 3670 Romnay Rd
- 2411 Sheringham Rd
- 4370 Harborough Rd
- 2475 Mccoy Rd
- 2533 Middlesex Rd
- 3949 Norbrook Dr
- 2413 Edgevale Rd
- 2458 Edgevale Rd
- 1605 Lafayette Dr Unit 1605
- 1594 Lafayette Dr Unit 1594
- 2177 Oakmount Rd
- 2443 Shrewsbury Rd
- 2480 Shrewsbury Rd
- 2424 Nottingham Rd
- 3418 Sunningdale Way
- 2257 Swansea Rd
- 3275 Colchester Rd
- 2375 Swansea Rd
- 1165 Highland Dr
- 4020 Mountview Rd
- 4042 Mountview Rd
- 4025 Fenwick Rd
- 4035 Fenwick Rd
- 4015 Fenwick Rd
- 4041 Mountview Rd
- 4054 Mountview Rd
- 4008 Mountview Rd
- 4047 Fenwick Rd
- 4001 Fenwick Rd
- 2031 Haviland Rd
- 2050 Nayland Rd
- 3996 Mountview Rd
- 3991 Fenwick Rd
- 2053 Nayland Rd
- 2043 Haviland Rd
- 4076 Mountview Rd
- 4020 Newhall Rd
- 3995 Mountview Rd
- 4040 Fenwick Rd
Your Personal Tour Guide
Ask me questions while you tour the home.