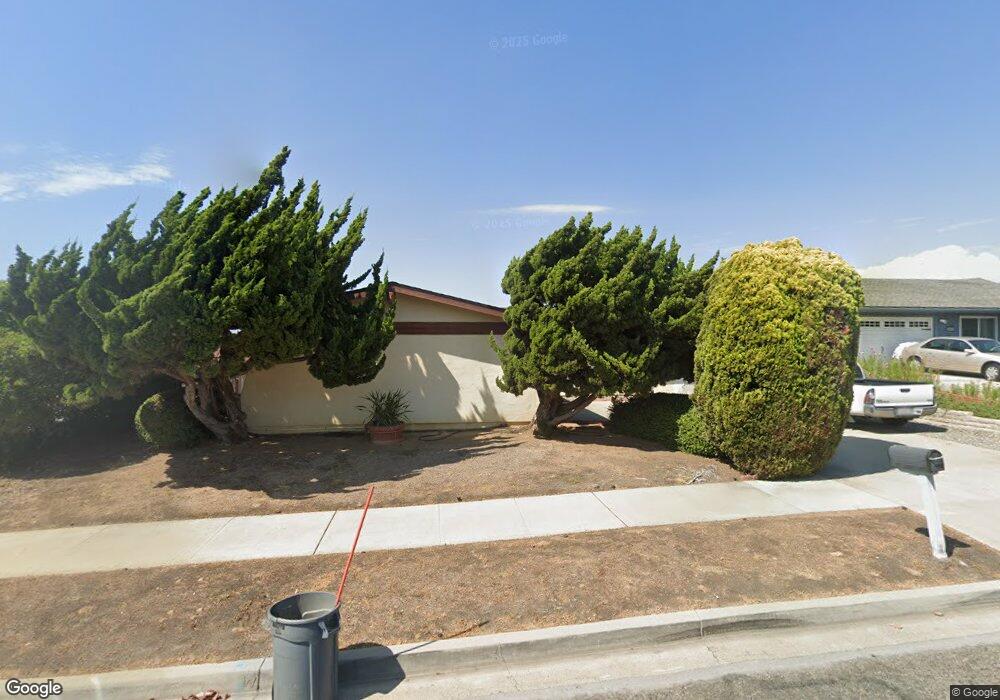
4032 Via Serra Oceanside, CA 92057
San Luis Rey NeighborhoodEstimated Value: $813,000 - $862,000
3
Beds
2
Baths
1,593
Sq Ft
$522/Sq Ft
Est. Value
About This Home
This home is located at 4032 Via Serra, Oceanside, CA 92057 and is currently estimated at $831,904, approximately $522 per square foot. 4032 Via Serra is a home located in San Diego County with nearby schools including Nichols Elementary School, Martin Luther King Jr. Middle School, and El Camino High School.
Ownership History
Date
Name
Owned For
Owner Type
Purchase Details
Closed on
Apr 17, 2006
Sold by
Hunt Kyle E and Hunt Mary J
Bought by
Hunt Mary J and Hunt Kyle Eugene
Current Estimated Value
Home Financials for this Owner
Home Financials are based on the most recent Mortgage that was taken out on this home.
Original Mortgage
$308,000
Outstanding Balance
$176,895
Interest Rate
6.35%
Mortgage Type
New Conventional
Estimated Equity
$655,009
Purchase Details
Closed on
Mar 21, 2006
Sold by
Hunt Kyle E
Bought by
Hunt Kyle E and Hunt Mary J
Home Financials for this Owner
Home Financials are based on the most recent Mortgage that was taken out on this home.
Original Mortgage
$308,000
Outstanding Balance
$176,895
Interest Rate
6.35%
Mortgage Type
New Conventional
Estimated Equity
$655,009
Purchase Details
Closed on
Sep 15, 2005
Sold by
Hunt Mary J
Bought by
Hunt Kyle E
Home Financials for this Owner
Home Financials are based on the most recent Mortgage that was taken out on this home.
Original Mortgage
$300,000
Interest Rate
1%
Mortgage Type
New Conventional
Purchase Details
Closed on
Jun 19, 1989
Create a Home Valuation Report for This Property
The Home Valuation Report is an in-depth analysis detailing your home's value as well as a comparison with similar homes in the area
Home Values in the Area
Average Home Value in this Area
Purchase History
| Date | Buyer | Sale Price | Title Company |
|---|---|---|---|
| Hunt Mary J | -- | Lawyers Title Company | |
| Hunt Kyle E | -- | None Available | |
| Hunt Kyle E | -- | Commonwealth Land Title Comp | |
| -- | $168,000 | -- |
Source: Public Records
Mortgage History
| Date | Status | Borrower | Loan Amount |
|---|---|---|---|
| Open | Hunt Mary J | $308,000 | |
| Closed | Hunt Kyle E | $300,000 |
Source: Public Records
Tax History
| Year | Tax Paid | Tax Assessment Tax Assessment Total Assessment is a certain percentage of the fair market value that is determined by local assessors to be the total taxable value of land and additions on the property. | Land | Improvement |
|---|---|---|---|---|
| 2025 | $3,428 | $315,224 | $51,349 | $263,875 |
| 2024 | $3,428 | $309,044 | $50,343 | $258,701 |
| 2023 | $3,321 | $302,985 | $49,356 | $253,629 |
| 2022 | $3,270 | $297,045 | $48,389 | $248,656 |
| 2021 | $3,281 | $291,222 | $47,441 | $243,781 |
| 2020 | $3,179 | $288,237 | $46,955 | $241,282 |
| 2019 | $3,086 | $282,586 | $46,035 | $236,551 |
| 2018 | $3,052 | $277,046 | $45,133 | $231,913 |
| 2017 | $2,995 | $271,615 | $44,249 | $227,366 |
| 2016 | $2,896 | $266,290 | $43,382 | $222,908 |
| 2015 | $2,811 | $262,291 | $42,731 | $219,560 |
| 2014 | $2,702 | $257,154 | $41,894 | $215,260 |
Source: Public Records
Map
Nearby Homes
- 41 Hummingbird Ln
- 99 Pheasant Ln Unit T
- 61 Hummingbird Ln
- 176 Flicker Ln
- 65 Hummingbird Ln
- 168 Roadrunner Ln
- 4146 Mission Tree Way
- 4196 Camino Campana
- 4130 Via Del Rey
- 4104 Vela Way
- 4131 Vela Way
- 4235 Calle Del Vista
- 4314 Black Canyon Way
- 4132 Calle Arbol
- 293 Reef Point Way Unit 6
- 293 Reef Point Way
- 4211 Mission Ranch Way
- 310 Sunset Way Unit 5
- 305 Liberty Way
- 250 Liberty Way
- 4036 Via Serra
- 4028 Via Serra
- 4045 Via Los Padres
- 4025 Via Aldea
- 4024 Via Serra
- 4021 Via Aldea
- 4031 Via Serra
- 4041 Via Los Padres
- 4035 Via Serra
- 4023 Via Serra
- 4050 Via Los Padres
- 4020 Via Serra
- 4030 Via Aldea
- 4046 Via Los Padres
- 4019 Via Aldea
- 4054 Via Los Padres
- 4042 Via Los Padres
- 4037 Via Los Padres
- 4019 Via Serra
- 4058 Via Los Padres
Your Personal Tour Guide
Ask me questions while you tour the home.