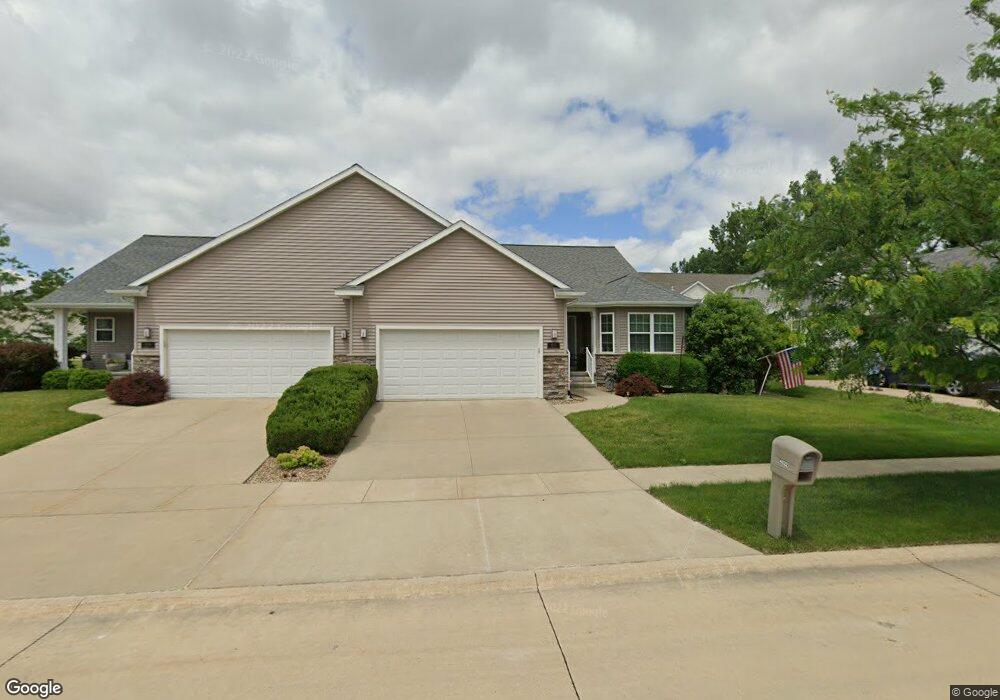
4032 Willowind St NE Cedar Rapids, IA 52411
Estimated Value: $373,270 - $391,000
3
Beds
4
Baths
1,869
Sq Ft
$203/Sq Ft
Est. Value
About This Home
This home is located at 4032 Willowind St NE, Cedar Rapids, IA 52411 and is currently estimated at $379,068, approximately $202 per square foot. 4032 Willowind St NE is a home located in Linn County with nearby schools including Maple Grove Elementary School, Taft Middle School, and John F. Kennedy High School.
Ownership History
Date
Name
Owned For
Owner Type
Purchase Details
Closed on
Dec 7, 2023
Sold by
Cerny Joyce V and Cerny Jerry L
Bought by
Joyce V Cerny Revocable Trust
Current Estimated Value
Purchase Details
Closed on
Dec 21, 2010
Sold by
Jim Sattler Inc
Bought by
Cerny Joyce V and Cerny Jerry L
Home Financials for this Owner
Home Financials are based on the most recent Mortgage that was taken out on this home.
Original Mortgage
$220,000
Interest Rate
4.16%
Mortgage Type
New Conventional
Purchase Details
Closed on
Dec 22, 2009
Sold by
Village Partners Llc
Bought by
Jim Sattler Inc
Home Financials for this Owner
Home Financials are based on the most recent Mortgage that was taken out on this home.
Original Mortgage
$222,750
Interest Rate
4.84%
Mortgage Type
Unknown
Create a Home Valuation Report for This Property
The Home Valuation Report is an in-depth analysis detailing your home's value as well as a comparison with similar homes in the area
Purchase History
| Date | Buyer | Sale Price | Title Company |
|---|---|---|---|
| Joyce V Cerny Revocable Trust | -- | None Listed On Document | |
| Cerny Joyce V | $303,000 | None Available | |
| Jim Sattler Inc | -- | None Available |
Source: Public Records
Mortgage History
| Date | Status | Borrower | Loan Amount |
|---|---|---|---|
| Previous Owner | Cerny Joyce V | $220,000 | |
| Previous Owner | Jim Sattler Inc | $222,750 |
Source: Public Records
Tax History
| Year | Tax Paid | Tax Assessment Tax Assessment Total Assessment is a certain percentage of the fair market value that is determined by local assessors to be the total taxable value of land and additions on the property. | Land | Improvement |
|---|---|---|---|---|
| 2025 | $5,974 | $350,400 | $52,600 | $297,800 |
| 2024 | $6,194 | $363,700 | $52,600 | $311,100 |
| 2023 | $6,194 | $363,700 | $52,600 | $311,100 |
| 2022 | $6,080 | $305,900 | $46,200 | $259,700 |
| 2021 | $6,932 | $305,900 | $46,200 | $259,700 |
| 2020 | $6,932 | $326,100 | $46,200 | $279,900 |
| 2019 | $6,554 | $315,800 | $20,500 | $295,300 |
Source: Public Records
Map
Nearby Homes
- 5020 Erin Ct NE
- 4105 Majestic Ct NE
- 3801 Willowbend Ct NE
- 4007 Treeline Ct NE
- 5005 Willowbend Rd NE
- 3905 Riverside Dr NE
- 3817 Riverside Dr NE
- 3427 Riverbend Dr NE
- 4612 Chestnut Ridge Ct NE
- 3310 Riverside Dr NE
- 5230 Edgewood Rd NE
- 4620 N River Blvd NE
- 3315 Riverpointe Cir NE
- 5407 Seminole Valley Trail NE
- 5419 Seminole Valley Trl Ne - New Build
- 5419 Seminole Valley Trl Ne-New Build
- 5402 Seminole Valley Trail NE
- 5425 Seminole Valley Trail NE
- 5821 River Pkwy NE
- 5434 Seminole Valley Trail NE
- 4026 Willowind St NE
- 4036 Willowind St NE
- 4104 Willowood St NE
- 4022 Willowind St NE
- 4110 Willowood St NE
- 4100 Willowood St NE
- 4114 Willowood St NE
- 4006 Willowind St NE
- 4012 Willowind St NE
- 4002 Willowind St NE
- 4016 Willowind St NE
- 4101 N Willowbend Rd NE
- 4029 N Willowbend Rd NE
- 4111 N Willowbend Rd NE
- 4121 Treeline Ct NE
- 4130 N Willowbend Rd NE
- 4117 Treeline Ct NE Unit 4117
- 4025 N Willowbend Rd NE
- 4125 Treeline Ct NE
- 4113 N Willowbend Rd NE
Your Personal Tour Guide
Ask me questions while you tour the home.