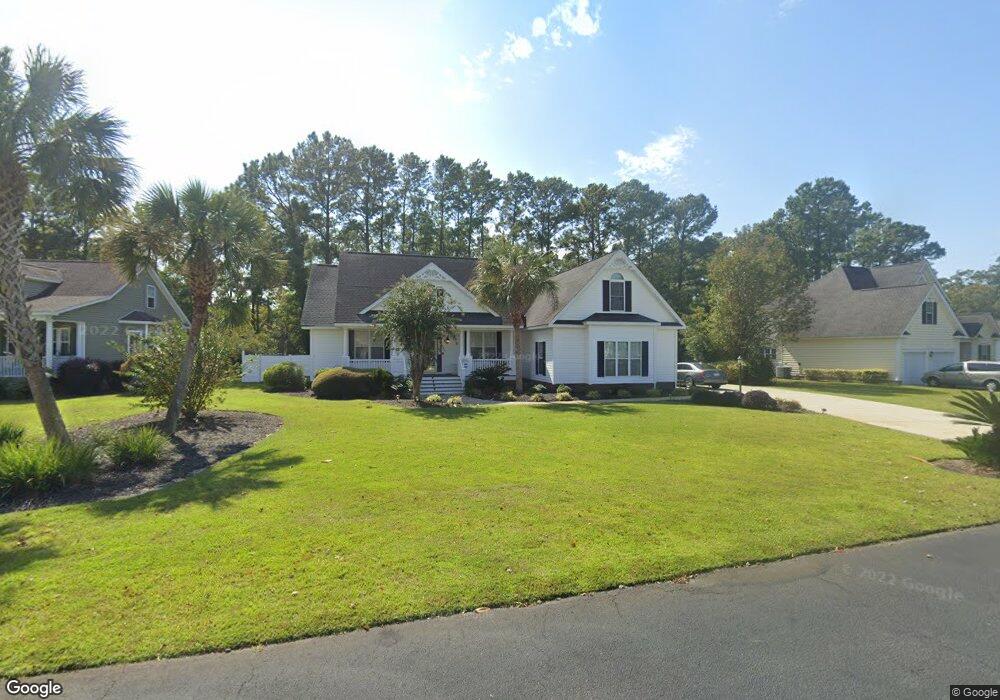
4033 Bayfield Loop Murrells Inlet, SC 29576
Estimated Value: $547,281 - $688,000
3
Beds
2
Baths
2,485
Sq Ft
$255/Sq Ft
Est. Value
About This Home
This home is located at 4033 Bayfield Loop, Murrells Inlet, SC 29576 and is currently estimated at $634,070, approximately $255 per square foot. 4033 Bayfield Loop is a home located in Georgetown County with nearby schools including Waccamaw Elementary School, Waccamaw Intermediate School, and Waccamaw Middle School.
Ownership History
Date
Name
Owned For
Owner Type
Purchase Details
Closed on
Jun 17, 2021
Sold by
Yarborough Edna C
Bought by
Yarborough Edna
Current Estimated Value
Purchase Details
Closed on
Sep 28, 2004
Sold by
Daniel Realty Investments Inc
Bought by
Yarborough James L and Yarborough Edna C
Purchase Details
Closed on
Jan 21, 2003
Sold by
Lipton Howard Kent
Bought by
Daniel Realty Investments Inc
Purchase Details
Closed on
Sep 1, 2000
Sold by
Bellamy Properties Inc and Bellamy Ruby Cannon
Bought by
Lipton Howard Kent
Create a Home Valuation Report for This Property
The Home Valuation Report is an in-depth analysis detailing your home's value as well as a comparison with similar homes in the area
Home Values in the Area
Average Home Value in this Area
Purchase History
| Date | Buyer | Sale Price | Title Company |
|---|---|---|---|
| Yarborough Edna | -- | None Available | |
| Yarborough James L | $305,000 | -- | |
| Daniel Realty Investments Inc | $53,000 | -- | |
| Lipton Howard Kent | $44,000 | -- |
Source: Public Records
Tax History Compared to Growth
Tax History
| Year | Tax Paid | Tax Assessment Tax Assessment Total Assessment is a certain percentage of the fair market value that is determined by local assessors to be the total taxable value of land and additions on the property. | Land | Improvement |
|---|---|---|---|---|
| 2024 | $1,402 | $11,470 | $2,400 | $9,070 |
| 2023 | $1,402 | $11,470 | $2,400 | $9,070 |
| 2022 | $1,181 | $11,470 | $2,400 | $9,070 |
| 2021 | $1,145 | $11,464 | $2,400 | $9,064 |
| 2020 | $1,142 | $11,464 | $2,400 | $9,064 |
| 2019 | $1,138 | $11,488 | $2,400 | $9,088 |
| 2018 | $1,167 | $114,880 | $0 | $0 |
| 2017 | $994 | $114,880 | $0 | $0 |
| 2016 | $984 | $11,488 | $0 | $0 |
| 2015 | $1,070 | $0 | $0 | $0 |
| 2014 | $1,070 | $306,200 | $54,400 | $251,800 |
| 2012 | -- | $306,200 | $54,400 | $251,800 |
Source: Public Records
Map
Nearby Homes
- 4004 Bayfield Loop
- 4691 Mill Pond Ct
- 4502 Firethorne Dr
- 853 Wachesaw Rd
- 1099 Wachesaw Rd
- 50 Turning Stone Blvd Unit 5
- 50 Turning Stone Blvd Unit 7
- 4568 Painted Fern Ct Unit 2B
- 416 Fountain Grass Ct Unit 6E
- 404 Fountain Grass Ct Unit 6B
- 400 Fountain Grass Ct Unit 6A
- 412 Fountain Grass Ct Unit 6D
- 408 Fountain Grass Ct Unit 6C
- 613 Fairgrass Ct Unit 35E
- 1095 Wachesaw Rd
- 1201 Wachesaw Rd
- 211 Chesapeake Ln
- 4504 Fulton Place
- 4536 Fringetree Dr
- 120 Brentwood Dr Unit G
- 4035 Bayfield Loop
- 4031 Bayfield Loop
- 4037 Bayfield Loop
- 4034 Bayfield Loop
- 4044 Longleaf Ln
- 4032 Bayfield Loop
- 4043 Longleaf Ln
- 4026 Bayfield Loop
- 4030 Bayfield Loop
- 4024 Bayfield Loop
- 4001 Bayfield Loop
- 4003 Bayfield Loop
- 4028 Bayfield Loop
- 4042 Longleaf Ln
- 4042 Longleaf Ln Unit Bayfield
- 4042 Longleaf Ln Unit Bayfield Estates
- 4022 Bayfield Loop
- 4041 Longleaf Ln Unit Bayfield Loop
- 4041 Longleaf Ln
- 4503 Tiger Ln