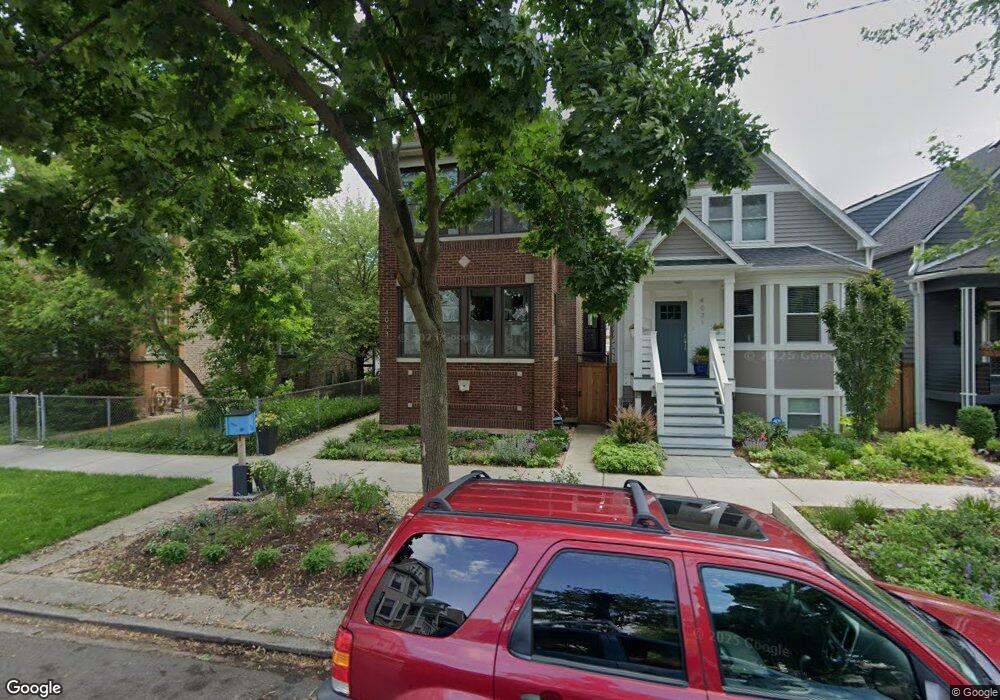
4033 N Spaulding Ave Unit 1 Chicago, IL 60618
Irving Park NeighborhoodEstimated Value: $775,000 - $967,323
3
Beds
4
Baths
2,234
Sq Ft
$405/Sq Ft
Est. Value
About This Home
This home is located at 4033 N Spaulding Ave Unit 1, Chicago, IL 60618 and is currently estimated at $904,331, approximately $404 per square foot. 4033 N Spaulding Ave Unit 1 is a home located in Cook County with nearby schools including Bateman Elementary School, Roosevelt High School, and CICS Irving Park.
Ownership History
Date
Name
Owned For
Owner Type
Purchase Details
Closed on
May 30, 2019
Sold by
Ipak Development Llc
Bought by
Murray Scott Hartland and Murray Linda Ann
Current Estimated Value
Home Financials for this Owner
Home Financials are based on the most recent Mortgage that was taken out on this home.
Original Mortgage
$572,000
Outstanding Balance
$508,062
Interest Rate
4.62%
Mortgage Type
Adjustable Rate Mortgage/ARM
Estimated Equity
$396,269
Purchase Details
Closed on
Aug 15, 2017
Sold by
Alonso Juana A and Alonso Jaime R
Bought by
Ipak Development Llc
Home Financials for this Owner
Home Financials are based on the most recent Mortgage that was taken out on this home.
Original Mortgage
$340,550
Interest Rate
5.5%
Mortgage Type
Construction
Purchase Details
Closed on
Oct 3, 1994
Sold by
Alonzo Maria and Alonzo Juana A
Bought by
Alonzo Juana A and Alonzo Jaime R
Create a Home Valuation Report for This Property
The Home Valuation Report is an in-depth analysis detailing your home's value as well as a comparison with similar homes in the area
Home Values in the Area
Average Home Value in this Area
Purchase History
| Date | Buyer | Sale Price | Title Company |
|---|---|---|---|
| Murray Scott Hartland | $715,000 | Old Republic National Title | |
| Ipak Development Llc | $315,000 | None Available | |
| Alonzo Juana A | -- | -- |
Source: Public Records
Mortgage History
| Date | Status | Borrower | Loan Amount |
|---|---|---|---|
| Open | Murray Scott Hartland | $572,000 | |
| Previous Owner | Ipak Development Llc | $340,550 |
Source: Public Records
Tax History Compared to Growth
Tax History
| Year | Tax Paid | Tax Assessment Tax Assessment Total Assessment is a certain percentage of the fair market value that is determined by local assessors to be the total taxable value of land and additions on the property. | Land | Improvement |
|---|---|---|---|---|
| 2024 | $14,438 | $78,000 | $19,530 | $58,470 |
| 2023 | $14,053 | $71,500 | $15,750 | $55,750 |
| 2022 | $14,053 | $71,500 | $15,750 | $55,750 |
| 2021 | $13,753 | $71,500 | $15,750 | $55,750 |
| 2020 | $8,263 | $40,066 | $6,930 | $33,136 |
| 2019 | $8,283 | $44,518 | $6,930 | $37,588 |
| 2018 | $2,118 | $10,688 | $6,930 | $3,758 |
| 2017 | $6,074 | $31,500 | $6,300 | $25,200 |
| 2016 | $6,080 | $33,464 | $6,300 | $27,164 |
| 2015 | $5,533 | $33,464 | $6,300 | $27,164 |
| 2014 | $5,409 | $31,617 | $5,670 | $25,947 |
| 2013 | $5,291 | $31,617 | $5,670 | $25,947 |
Source: Public Records
Map
Nearby Homes
- 4018 N Spaulding Ave Unit 2
- 3223 W Belle Plaine Ave
- 3934 N Sawyer Ave
- 4116 N Kedzie Ave
- 3940 N Christiana Ave
- 4026 N Kimball Ave
- 3247 W Berteau Ave
- 4027 N Troy St
- 4141 N Kedzie Ave Unit 307
- 3911 N Kedzie Ave
- 3853 N Spaulding Ave
- 3855 N Christiana Ave
- 3923 N Bernard St
- 4155 N Bernard St Unit G
- 4015 N Albany Ave
- 4248 N Sawyer Ave
- 4231 N Kedzie Ave Unit 3E
- 3908 N Bernard St
- 3042 W Irving Park Rd
- 3925 N Saint Louis Ave
- 4033 N Spaulding Ave
- 4031 N Spaulding Ave
- 4037 N Spaulding Ave
- 4037 N Spaulding Ave
- 4029 N Spaulding Ave
- 4027 N Spaulding Ave
- 4027 N Spaulding Ave Unit 2
- 4027 N Spaulding Ave
- 4041 N Spaulding Ave
- 4043 N Spaulding Ave
- 4043 N Spaulding Ave Unit 3
- 4025 N Spaulding Ave Unit 2
- 4023 N Spaulding Ave
- 3300 W Cuyler Ave
- 3300 W Cuyler Ave
- 4018 N Spaulding Ave Unit 4018
- 4018 N Spaulding Ave Unit 4018
- 4018 N Spaulding Ave Unit 4018
- 4018 N Spaulding Ave Unit 4018
- 4018 N Spaulding Ave Unit 3