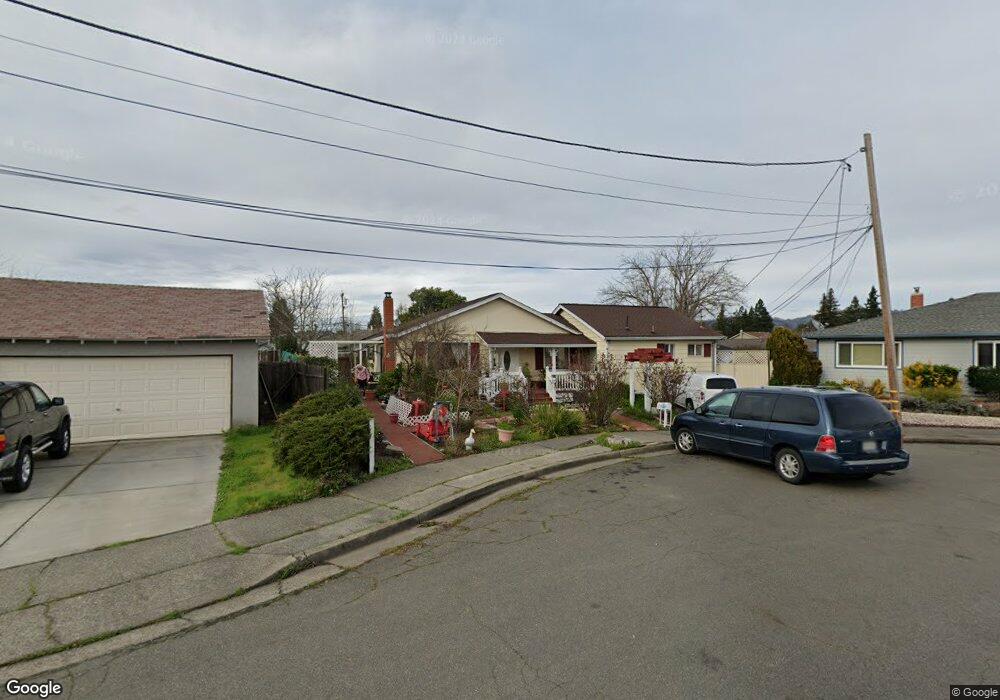
4033 Phoenix Ave Santa Rosa, CA 95405
Montgomery Village NeighborhoodEstimated Value: $794,755 - $908,000
5
Beds
3
Baths
1,980
Sq Ft
$422/Sq Ft
Est. Value
About This Home
This home is located at 4033 Phoenix Ave, Santa Rosa, CA 95405 and is currently estimated at $835,439, approximately $421 per square foot. 4033 Phoenix Ave is a home located in Sonoma County with nearby schools including Herbert Slater Middle School, Montgomery High School, and Village Elementary Charter School.
Ownership History
Date
Name
Owned For
Owner Type
Purchase Details
Closed on
Mar 18, 2013
Sold by
Stanley Patricia Irene
Bought by
Stanley Dirk C and Stanley Timothy R
Current Estimated Value
Purchase Details
Closed on
Nov 8, 2005
Sold by
Stanley Douglas J
Bought by
Stanley Patricia Irene
Purchase Details
Closed on
Oct 19, 2005
Sold by
Stanley Timothy Robert
Bought by
Stanley Patricia Irene
Purchase Details
Closed on
Sep 26, 2005
Sold by
Stanley Dirk
Bought by
Stanley Patricia Irene
Purchase Details
Closed on
Jun 19, 1999
Sold by
Stanley Dirk C
Bought by
Stanley Patricia I
Purchase Details
Closed on
Nov 20, 1998
Sold by
Stanley Patricia I
Bought by
Stanley Dirk C and Stanley Timothy R
Purchase Details
Closed on
Jun 16, 1998
Sold by
Stanley Patricia I
Bought by
Stanley Dirk C and Stanley Timothy R
Purchase Details
Closed on
Mar 22, 1995
Sold by
Stanley Patricia I
Bought by
Tim Douglas and Stanley Dirk
Create a Home Valuation Report for This Property
The Home Valuation Report is an in-depth analysis detailing your home's value as well as a comparison with similar homes in the area
Home Values in the Area
Average Home Value in this Area
Purchase History
| Date | Buyer | Sale Price | Title Company |
|---|---|---|---|
| Stanley Dirk C | -- | None Available | |
| Stanley Patricia Irene | -- | -- | |
| Stanley Patricia Irene | -- | -- | |
| Stanley Patricia Irene | -- | -- | |
| Stanley Patricia I | -- | -- | |
| Stanley Dirk C | -- | -- | |
| Stanley Dirk C | -- | -- | |
| Tim Douglas | -- | -- |
Source: Public Records
Tax History Compared to Growth
Tax History
| Year | Tax Paid | Tax Assessment Tax Assessment Total Assessment is a certain percentage of the fair market value that is determined by local assessors to be the total taxable value of land and additions on the property. | Land | Improvement |
|---|---|---|---|---|
| 2025 | $1,138 | $92,593 | $19,589 | $73,004 |
| 2024 | $1,138 | $90,778 | $19,205 | $71,573 |
| 2023 | $1,138 | $88,999 | $18,829 | $70,170 |
| 2022 | $1,052 | $87,255 | $18,460 | $68,795 |
| 2021 | $1,029 | $85,546 | $18,099 | $67,447 |
| 2020 | $1,024 | $84,670 | $17,914 | $66,756 |
| 2019 | $1,012 | $83,011 | $17,563 | $65,448 |
| 2018 | $1,001 | $81,384 | $17,219 | $64,165 |
| 2017 | $981 | $79,789 | $16,882 | $62,907 |
| 2016 | $957 | $78,225 | $16,551 | $61,674 |
| 2015 | $927 | $77,051 | $16,303 | $60,748 |
| 2014 | $893 | $75,543 | $15,984 | $59,559 |
Source: Public Records
Map
Nearby Homes
- 1925 Contra Costa Ave
- 4068 Siskiyou Ave
- 1941 Calavaras Dr
- 4127 Siskiyou Ave
- 3735 Sacramento Ave
- 1824 Arroyo Sierra Ct
- 2530 Tachevah Dr
- 3553 Fir Dr
- 2913 Carissa Ct
- 3563 Hoen Ave
- 1531 Camden Ct
- 4604 Parktrail Ct
- 1970 Neotomas Ave
- 2880 Creekside Rd
- 2625 Neotomas Ave
- 906 Woodlake Dr
- 1109 Evans Dr
- 1947 Knolls Dr
- 4713 Circle b Place
- 2162 Knolls Dr
- 4029 Phoenix Ave
- 4048 Sacramento Ave
- 4052 Sacramento Ave
- 4037 Phoenix Ave
- 4056 Sacramento Ave
- 4025 Phoenix Ave
- 4045 Phoenix Ave
- 4038 Sacramento Ave
- 4060 Sacramento Ave
- 4024 Phoenix Ave
- 1915 Marin Dr
- 2310 Olympia Dr
- 4017 Phoenix Ave
- 1919 Marin Dr
- 1911 Marin Dr
- 4041 Sacramento Ave
- 4032 Sacramento Ave
- 1923 Marin Dr
- 4035 Sacramento Ave
- 1907 Marin Dr