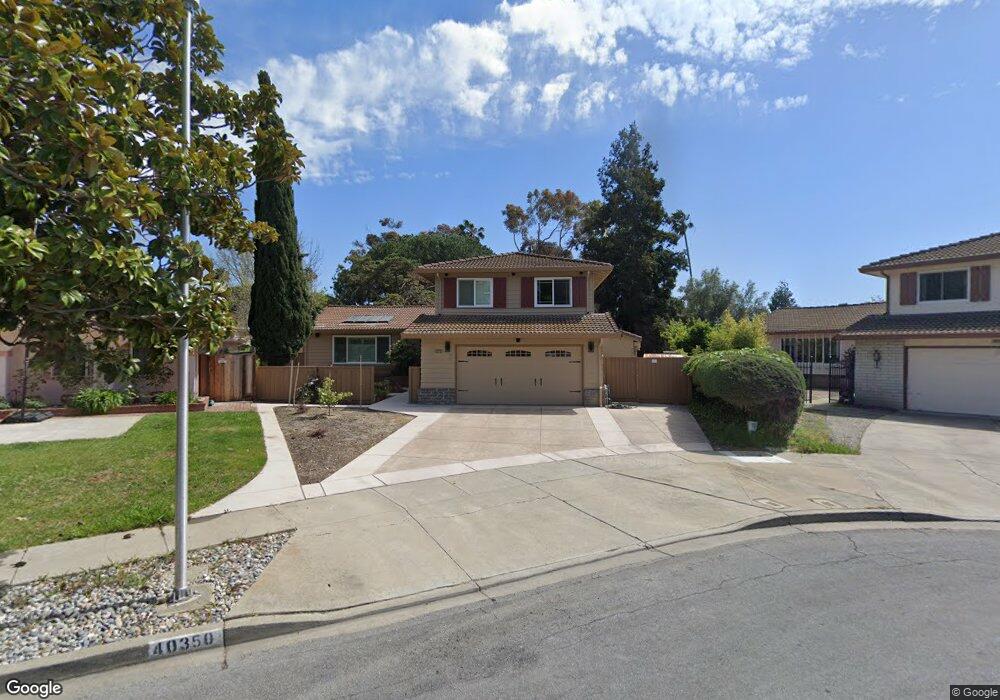
40350 San Sebastian Place Fremont, CA 94539
Kimber-Gomes NeighborhoodEstimated Value: $2,521,000 - $3,447,000
6
Beds
4
Baths
2,862
Sq Ft
$1,065/Sq Ft
Est. Value
About This Home
This home is located at 40350 San Sebastian Place, Fremont, CA 94539 and is currently estimated at $3,048,482, approximately $1,065 per square foot. 40350 San Sebastian Place is a home located in Alameda County with nearby schools including John Gomes Elementary School, William Hopkins Junior High School, and Mission San Jose High School.
Ownership History
Date
Name
Owned For
Owner Type
Purchase Details
Closed on
May 12, 2017
Sold by
Reynolds Jerry Robert and Reynolds Jacque Marie
Bought by
Chong Wei Hoe and Tan Sui
Current Estimated Value
Home Financials for this Owner
Home Financials are based on the most recent Mortgage that was taken out on this home.
Original Mortgage
$1,170,000
Outstanding Balance
$972,465
Interest Rate
4.08%
Mortgage Type
New Conventional
Estimated Equity
$2,076,017
Purchase Details
Closed on
Sep 3, 2015
Sold by
Reynolds Jerry R and Reynolds Jacque M
Bought by
J & J 2015 Trust
Purchase Details
Closed on
Jan 10, 2007
Sold by
Reynolds Jerry R and Reynolds Jacque M
Bought by
Reynolds Jerry R and Reynolds Jacque M
Home Financials for this Owner
Home Financials are based on the most recent Mortgage that was taken out on this home.
Original Mortgage
$735,000
Interest Rate
6.12%
Mortgage Type
New Conventional
Create a Home Valuation Report for This Property
The Home Valuation Report is an in-depth analysis detailing your home's value as well as a comparison with similar homes in the area
Home Values in the Area
Average Home Value in this Area
Purchase History
| Date | Buyer | Sale Price | Title Company |
|---|---|---|---|
| Chong Wei Hoe | $1,733,500 | Fidelity National Title Co | |
| J & J 2015 Trust | -- | None Available | |
| Reynolds Jerry R | -- | New Century Title Company |
Source: Public Records
Mortgage History
| Date | Status | Borrower | Loan Amount |
|---|---|---|---|
| Open | Chong Wei Hoe | $1,170,000 | |
| Previous Owner | Reynolds Jerry R | $735,000 |
Source: Public Records
Tax History Compared to Growth
Tax History
| Year | Tax Paid | Tax Assessment Tax Assessment Total Assessment is a certain percentage of the fair market value that is determined by local assessors to be the total taxable value of land and additions on the property. | Land | Improvement |
|---|---|---|---|---|
| 2025 | $23,089 | $2,004,830 | $603,491 | $1,408,339 |
| 2024 | $23,089 | $1,965,393 | $591,661 | $1,380,732 |
| 2023 | $22,501 | $1,933,719 | $580,060 | $1,353,659 |
| 2022 | $22,255 | $1,888,807 | $568,687 | $1,327,120 |
| 2021 | $21,697 | $1,851,640 | $557,538 | $1,301,102 |
| 2020 | $21,904 | $1,839,590 | $551,824 | $1,287,766 |
| 2019 | $21,646 | $1,803,533 | $541,008 | $1,262,525 |
| 2018 | $21,229 | $1,768,170 | $530,400 | $1,237,770 |
| 2017 | $2,719 | $189,116 | $70,072 | $119,044 |
| 2016 | $2,659 | $185,409 | $68,699 | $116,710 |
| 2015 | $2,611 | $182,624 | $67,667 | $114,957 |
| 2014 | $2,557 | $179,048 | $66,342 | $112,706 |
Source: Public Records
Map
Nearby Homes
- 40613 Encanto Way
- 40743 Rainwater Ct Unit 80
- 260 Jacaranda Dr
- 1401 Lemos Ln
- 39478 Zacate Ave
- 1123 Farragut Dr
- 41246 Mission Blvd
- 1962 Briscoe Terrace
- 39331 Marbella Terraza
- 41252 Mission Blvd
- 39285 Marbella Terraza Unit 9P
- 41043 Joyce Ave
- 41082 Joyce Ave
- 1910 Barrymore Common Unit C
- 1960 Barrymore Common Unit K
- 39199 Guardino Dr Unit 170
- 39199 Guardino Dr Unit 371
- 39199 Guardino Dr Unit 179
- 40469 Shaw Ct
- 39239 Walnut Terrace
- 40362 San Sebastian Place
- 40338 San Sebastian Place
- 40374 San Sebastian Place
- 40326 San Sebastian Place
- 40426 Carmelita Ct
- 40418 Carmelita Ct
- 40307 San Sebastian Place
- 40314 San Sebastian Place
- 40432 Carmelita Ct
- 40386 San Sebastian Place
- 40373 San Sebastian Place
- 40208 Hacienda Ct
- 523 Seville Place
- 40417 Carmelita Ct
- 40440 Carmelita Ct
- 40398 San Sebastian Place
- 40249 San Sebastian Place
- 40385 San Sebastian Place
- 40200 Hacienda Ct
- 40212 Hacienda Ct