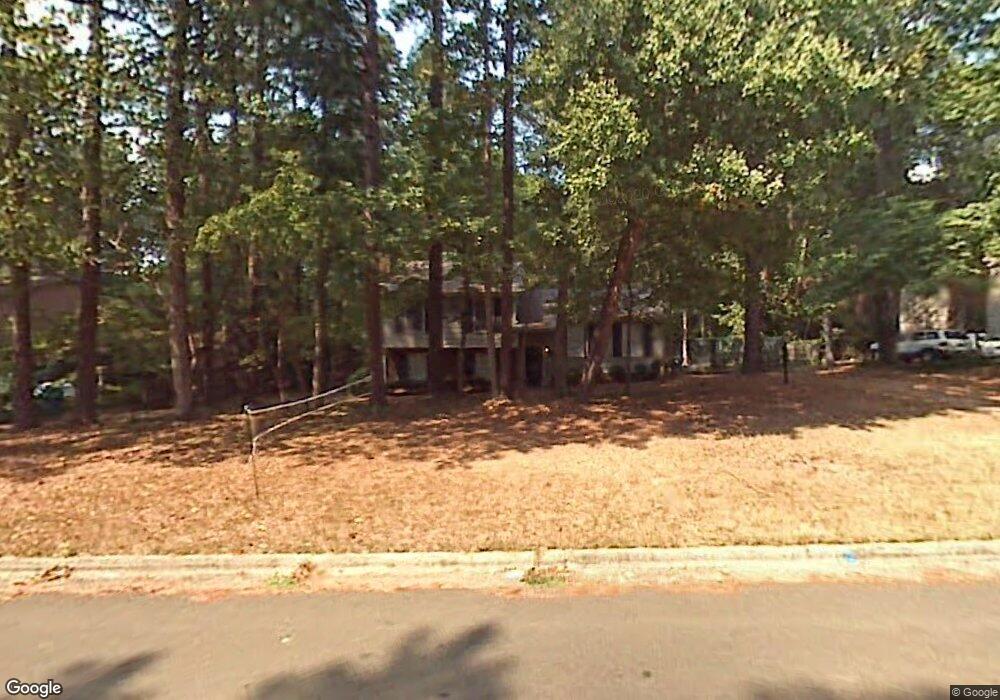
404 Brandywine Rd Chapel Hill, NC 27516
Estimated Value: $439,000 - $476,000
4
Beds
3
Baths
1,858
Sq Ft
$247/Sq Ft
Est. Value
About This Home
This home is located at 404 Brandywine Rd, Chapel Hill, NC 27516 and is currently estimated at $458,320, approximately $246 per square foot. 404 Brandywine Rd is a home located in Orange County with nearby schools including Northside Elementary School, Culbreth Middle School, and Carrboro High School.
Ownership History
Date
Name
Owned For
Owner Type
Purchase Details
Closed on
Jul 24, 2007
Sold by
Mimms Corrie
Bought by
Parker Sean
Current Estimated Value
Home Financials for this Owner
Home Financials are based on the most recent Mortgage that was taken out on this home.
Original Mortgage
$179,000
Outstanding Balance
$107,425
Interest Rate
5.75%
Mortgage Type
Purchase Money Mortgage
Estimated Equity
$350,895
Purchase Details
Closed on
Jul 25, 2003
Sold by
Wm Specialty Mortgage Llc
Bought by
Parker Sean and Mimms Corrie
Home Financials for this Owner
Home Financials are based on the most recent Mortgage that was taken out on this home.
Original Mortgage
$163,800
Interest Rate
3.75%
Mortgage Type
Fannie Mae Freddie Mac
Purchase Details
Closed on
May 19, 2003
Sold by
Stocks Tony
Bought by
Wm Specialty Mortgage Llc
Create a Home Valuation Report for This Property
The Home Valuation Report is an in-depth analysis detailing your home's value as well as a comparison with similar homes in the area
Home Values in the Area
Average Home Value in this Area
Purchase History
| Date | Buyer | Sale Price | Title Company |
|---|---|---|---|
| Parker Sean | -- | None Available | |
| Parker Sean | $182,000 | -- | |
| Wm Specialty Mortgage Llc | $154,125 | -- |
Source: Public Records
Mortgage History
| Date | Status | Borrower | Loan Amount |
|---|---|---|---|
| Open | Parker Sean | $179,000 | |
| Previous Owner | Parker Sean | $163,800 |
Source: Public Records
Tax History Compared to Growth
Tax History
| Year | Tax Paid | Tax Assessment Tax Assessment Total Assessment is a certain percentage of the fair market value that is determined by local assessors to be the total taxable value of land and additions on the property. | Land | Improvement |
|---|---|---|---|---|
| 2025 | $4,100 | $456,500 | $250,000 | $206,500 |
| 2024 | $3,267 | $271,700 | $110,000 | $161,700 |
| 2023 | $3,196 | $271,700 | $110,000 | $161,700 |
| 2022 | $3,145 | $271,700 | $110,000 | $161,700 |
| 2021 | $3,111 | $271,700 | $110,000 | $161,700 |
| 2020 | $3,077 | $251,600 | $100,000 | $151,600 |
| 2018 | $3,023 | $251,600 | $100,000 | $151,600 |
| 2017 | $2,774 | $251,600 | $100,000 | $151,600 |
| 2016 | $2,774 | $224,778 | $65,351 | $159,427 |
| 2015 | $2,774 | $224,778 | $65,351 | $159,427 |
| 2014 | $2,754 | $224,778 | $65,351 | $159,427 |
Source: Public Records
Map
Nearby Homes
- 403 Brandywine Rd
- 3537 Lodge Trail
- 1705 Smith Level Rd Unit A
- 708 October Woods Rd
- 2306 Damascus Church Rd
- 594 Cedar Lake Rd Unit A & B
- 82 Margaret Daniel Ln
- 348 Cedar Lake Rd Unit A & B
- 391 Northside Dr
- 52 Dogwood Acres Dr
- 103 Stonehill Rd
- 204 Twisted Oak Way
- Nora II Plan at Chapel Oaks
- Stoneridge Plan at Chapel Oaks
- Hampshire Plan at Chapel Oaks
- Kendrick Plan at Chapel Oaks
- Rosella Plan at Chapel Oaks
- Dunmore Plan at Chapel Oaks
- Halstead Plan at Chapel Oaks
- 1807 Old Lystra Rd
- 402 Brandywine Rd
- 406 Brandywine Rd
- 408 Brandywine Rd
- 105 Concord Dr
- 100 Saratoga Trail
- 405 Brandywine Rd
- 409 Brandywine Rd
- 407 Brandywine Rd
- 102 Saratoga Trail
- 103 Concord Dr
- 104 Saratoga Trail
- 401 Brandywine Rd
- 101 Concord Dr
- 107 Concord Dr
- 411 Brandywine Rd
- 410 Brandywine Rd
- 413 Brandywine Rd
- 412 Brandywine Rd
- 506 Yorktown Dr
- 504 Yorktown Dr