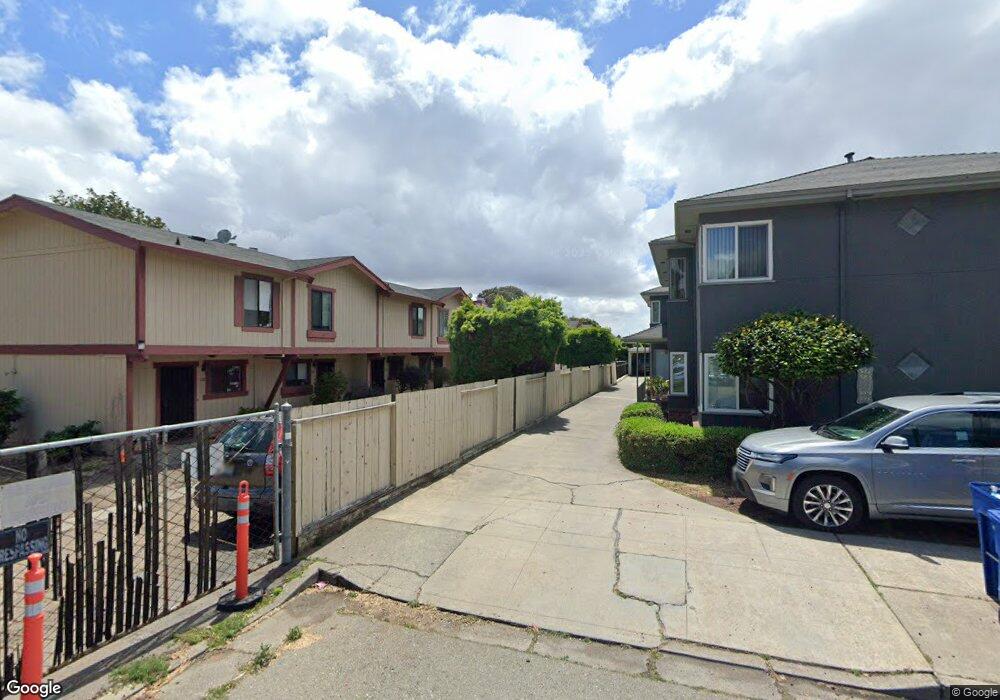
404 Callan Ave San Leandro, CA 94577
Estudillo Estates-Glen NeighborhoodEstimated Value: $416,657 - $492,000
2
Beds
2
Baths
1,156
Sq Ft
$406/Sq Ft
Est. Value
About This Home
This home is located at 404 Callan Ave, San Leandro, CA 94577 and is currently estimated at $469,914, approximately $406 per square foot. 404 Callan Ave is a home located in Alameda County with nearby schools including McKinley Elementary School, Bancroft Middle School, and San Leandro High School.
Ownership History
Date
Name
Owned For
Owner Type
Purchase Details
Closed on
Apr 15, 2016
Sold by
Crawford Felicia A
Bought by
Crawford Felicia A
Current Estimated Value
Home Financials for this Owner
Home Financials are based on the most recent Mortgage that was taken out on this home.
Original Mortgage
$181,800
Outstanding Balance
$144,429
Interest Rate
3.68%
Mortgage Type
New Conventional
Estimated Equity
$325,485
Purchase Details
Closed on
Apr 7, 2011
Sold by
Snyder Mariza
Bought by
Crawford Felicia A
Home Financials for this Owner
Home Financials are based on the most recent Mortgage that was taken out on this home.
Original Mortgage
$194,347
Interest Rate
4.9%
Mortgage Type
New Conventional
Purchase Details
Closed on
Jul 8, 2004
Sold by
Najibi Said and Najibi Kamela
Bought by
Snyder Mariza D
Home Financials for this Owner
Home Financials are based on the most recent Mortgage that was taken out on this home.
Original Mortgage
$229,600
Interest Rate
5.25%
Mortgage Type
Purchase Money Mortgage
Create a Home Valuation Report for This Property
The Home Valuation Report is an in-depth analysis detailing your home's value as well as a comparison with similar homes in the area
Home Values in the Area
Average Home Value in this Area
Purchase History
| Date | Buyer | Sale Price | Title Company |
|---|---|---|---|
| Crawford Felicia A | -- | First American Title Company | |
| Crawford Felicia A | $185,000 | Fidelity National Title Co | |
| Snyder Mariza D | $328,000 | Financial Title Company |
Source: Public Records
Mortgage History
| Date | Status | Borrower | Loan Amount |
|---|---|---|---|
| Open | Crawford Felicia A | $181,800 | |
| Closed | Crawford Felicia A | $194,347 | |
| Previous Owner | Snyder Mariza D | $229,600 | |
| Closed | Snyder Mariza D | $98,400 |
Source: Public Records
Tax History
| Year | Tax Paid | Tax Assessment Tax Assessment Total Assessment is a certain percentage of the fair market value that is determined by local assessors to be the total taxable value of land and additions on the property. | Land | Improvement |
|---|---|---|---|---|
| 2025 | $3,647 | $230,003 | $71,101 | $165,902 |
| 2024 | $3,647 | $225,357 | $69,707 | $162,650 |
| 2023 | $3,581 | $227,803 | $68,341 | $159,462 |
| 2022 | $3,480 | $216,337 | $67,001 | $156,336 |
| 2021 | $3,343 | $211,958 | $65,687 | $153,271 |
| 2020 | $3,230 | $216,714 | $65,014 | $151,700 |
| 2019 | $3,140 | $212,466 | $63,740 | $148,726 |
| 2018 | $3,038 | $208,301 | $62,490 | $145,811 |
| 2017 | $3,003 | $204,218 | $61,265 | $142,953 |
| 2016 | $2,852 | $200,215 | $60,064 | $140,151 |
| 2015 | $2,801 | $197,210 | $59,163 | $138,047 |
| 2014 | $2,773 | $193,347 | $58,004 | $135,343 |
Source: Public Records
Map
Nearby Homes
- 523 Pala Ave
- 483 Joaquin Ave
- 275 Haas Ave
- 845 Woodland Ave
- 236 Haas Ave
- 1053 San Jose St
- 576 Begier Ave
- 1550 Bancroft Ave Unit 112
- 1550 Bancroft Ave Unit 223
- 737 Cary Dr
- 65 Thornton St
- 308 Elsie Ave
- 400 Davis St Unit 301
- 1599 Hays St Unit 306
- 1400 Carpentier St
- 1400 Carpentier St Unit 315
- 532 Lafayette Ave
- 76 Georgia Way
- 819 Superior Ave
- 824 Maud Ave
- 412 Callan Ave
- 410 Callan Ave Unit 8
- 408 Callan Ave
- 406 Callan Ave Unit 6
- 402 Callan Ave
- 400 Callan Ave
- 416 Callan Ave
- 382 Callan Ave
- 418 Callan Ave
- 398 Callan Ave
- 392 Callan Ave
- 420 Callan Ave
- 379 Chumalia St
- 396 Callan Ave
- 424 Callan Ave
- 424 Callan Ave
- 398 Chumalia St
- 384 Chumalia St
- 474 Callan Ave
- 1159 Huff Ave
Your Personal Tour Guide
Ask me questions while you tour the home.