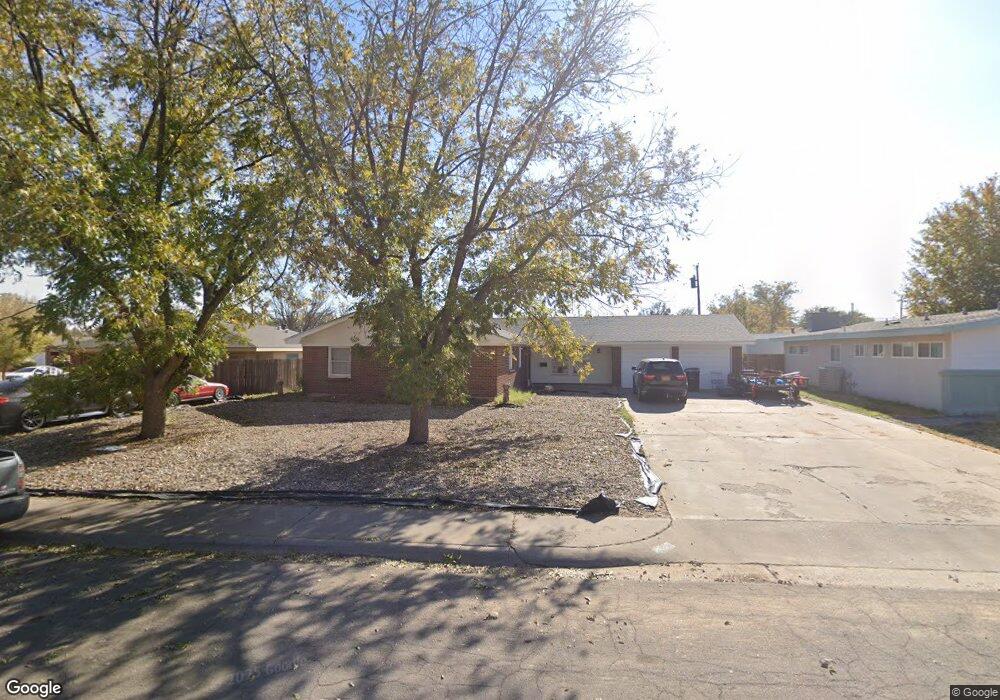
404 Chico Dr Roswell, NM 88201
Estimated Value: $81,000 - $236,000
3
Beds
2
Baths
1,769
Sq Ft
$99/Sq Ft
Est. Value
About This Home
This home is located at 404 Chico Dr, Roswell, NM 88201 and is currently estimated at $175,042, approximately $98 per square foot. 404 Chico Dr is a home located in Chaves County with nearby schools including Del Norte Elementary School, Berrendo Middle School, and Goddard High School.
Ownership History
Date
Name
Owned For
Owner Type
Purchase Details
Closed on
Oct 4, 2017
Sold by
Perna Anderson Rita
Bought by
Anderson Lawrence and Anderson Leslie
Current Estimated Value
Home Financials for this Owner
Home Financials are based on the most recent Mortgage that was taken out on this home.
Original Mortgage
$91,972
Interest Rate
3.82%
Mortgage Type
Future Advance Clause Open End Mortgage
Purchase Details
Closed on
Sep 1, 2017
Sold by
Anderson Lawrence
Bought by
Anderson Lawrence and Anderson Leslie
Home Financials for this Owner
Home Financials are based on the most recent Mortgage that was taken out on this home.
Original Mortgage
$91,972
Interest Rate
3.82%
Mortgage Type
Future Advance Clause Open End Mortgage
Purchase Details
Closed on
Jun 4, 2010
Sold by
Anderson Lawrence
Bought by
Andeson Lawrence and Perna Anderson Rita
Purchase Details
Closed on
Dec 26, 2008
Sold by
Anderson Lawrence and Anderson Annette
Bought by
Anderson Lawrence
Create a Home Valuation Report for This Property
The Home Valuation Report is an in-depth analysis detailing your home's value as well as a comparison with similar homes in the area
Home Values in the Area
Average Home Value in this Area
Purchase History
| Date | Buyer | Sale Price | Title Company |
|---|---|---|---|
| Anderson Lawrence | -- | Fidelity National Title Albu | |
| Anderson Lawrence | -- | Fidelity National Title | |
| Andeson Lawrence | -- | None Available | |
| Anderson Lawrence | -- | None Available |
Source: Public Records
Mortgage History
| Date | Status | Borrower | Loan Amount |
|---|---|---|---|
| Closed | Anderson Lawrence | $91,972 |
Source: Public Records
Tax History Compared to Growth
Tax History
| Year | Tax Paid | Tax Assessment Tax Assessment Total Assessment is a certain percentage of the fair market value that is determined by local assessors to be the total taxable value of land and additions on the property. | Land | Improvement |
|---|---|---|---|---|
| 2025 | $1,222 | $46,298 | $6,000 | $40,298 |
| 2024 | $1,222 | $44,950 | $6,000 | $38,950 |
| 2023 | $1,225 | $43,641 | $6,000 | $37,641 |
| 2022 | $1,178 | $42,370 | $6,000 | $36,370 |
| 2021 | $1,169 | $41,136 | $6,000 | $35,136 |
| 2020 | $1,135 | $39,938 | $6,000 | $33,938 |
| 2019 | $1,109 | $39,083 | $5,606 | $33,477 |
| 2018 | $1,075 | $37,945 | $5,283 | $32,662 |
| 2017 | $1,034 | $36,840 | $4,810 | $32,030 |
| 2016 | $994 | $35,767 | $4,400 | $31,367 |
| 2015 | $1,062 | $34,725 | $4,088 | $30,637 |
| 2014 | $2,062 | $33,713 | $3,756 | $29,957 |
Source: Public Records
Map
Nearby Homes
- 300 E Linda Vista Blvd
- 3307 Chiquita Ln
- 3210 N Garden Ave
- 200 Calle Del Sol
- 3014 Bandolina Ave
- 309 Broken Arrow Rd
- 3027 Alhambra Dr
- 3025 Alhambra Dr
- 604 Broken Arrow Rd
- 403 Swinging Spear Rd
- 307 Twin Diamond Rd
- 3007 Edgewood Dr
- 504 La Fonda Dr
- 2819 Delicado Dr
- 508 Sunrise Rd
- 3008 Belmont Dr
- 2816 Encanto Dr
- 703 E Mescalero Rd
- 702 Sunrise Rd
- 14 La Paz St
- 402 Chico Dr
- 3204 Delicado Dr
- 405 E Linda Vista Blvd
- 400 Chico Dr
- 403 Chico Dr
- 409 E Linda Vista Blvd
- 403 E Linda Vista Blvd
- 3207 Delicado Dr
- 3205 Delicado Dr
- 3209 Delicado Dr
- 3203 Delicado Dr
- 3205 Chiquita Ln
- 3201 Delicado Dr
- 3211 Delicado Dr
- 205 Linda Cir
- 3212 Delicado Dr
- 201 Linda Cir
- 3118 Delicado Dr