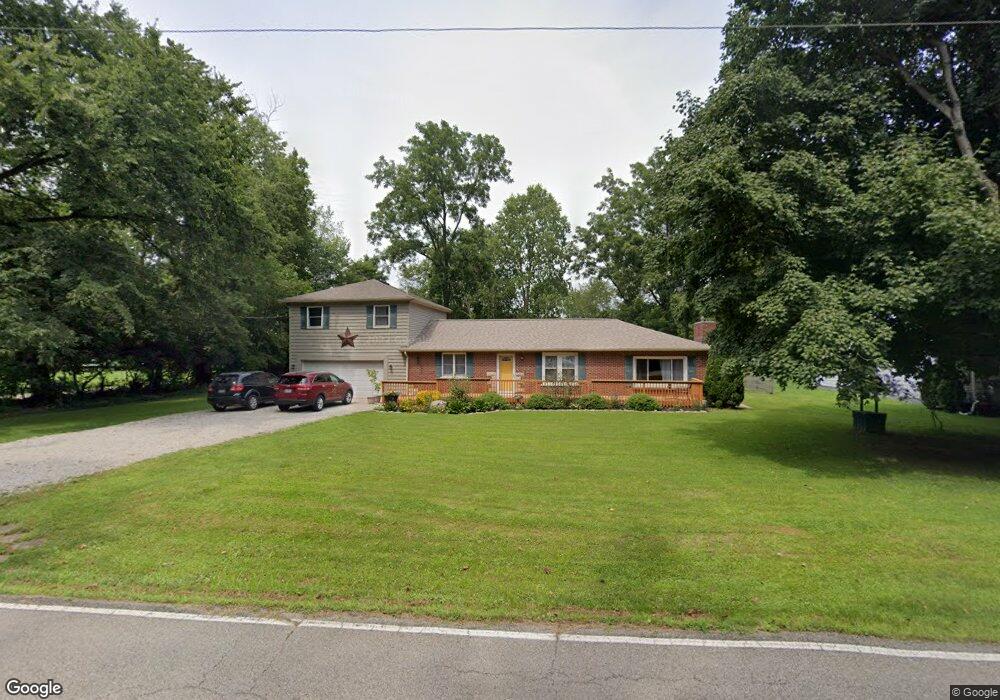
404 E Lower Springboro Rd Springboro, OH 45066
Estimated Value: $303,000 - $439,000
3
Beds
2
Baths
2,088
Sq Ft
$171/Sq Ft
Est. Value
About This Home
This home is located at 404 E Lower Springboro Rd, Springboro, OH 45066 and is currently estimated at $356,990, approximately $170 per square foot. 404 E Lower Springboro Rd is a home located in Warren County with nearby schools including Clearcreek Elementary School, Springboro Intermediate School, and Springboro Junior High School.
Ownership History
Date
Name
Owned For
Owner Type
Purchase Details
Closed on
Jul 29, 2010
Sold by
Murray Darren F and Murray Kathy
Bought by
Devoto Travis Francis and Devoto Marlo Dawn
Current Estimated Value
Home Financials for this Owner
Home Financials are based on the most recent Mortgage that was taken out on this home.
Original Mortgage
$137,700
Outstanding Balance
$89,979
Interest Rate
4.7%
Mortgage Type
New Conventional
Estimated Equity
$267,011
Purchase Details
Closed on
Nov 19, 2009
Sold by
Citimortgage Inc
Bought by
Murray Darren F
Purchase Details
Closed on
Jun 11, 2009
Sold by
George William B and St Felix Donna M
Bought by
Citimortgage Inc
Purchase Details
Closed on
May 1, 1991
Sold by
Centers Rick L and Centers Sue E.
Bought by
Morrison and Morrison Steven R
Purchase Details
Closed on
Mar 28, 1983
Sold by
Hammock Hammock and Hammock William E
Bought by
Centers & Rick L & Sue E and Centers Rick L
Create a Home Valuation Report for This Property
The Home Valuation Report is an in-depth analysis detailing your home's value as well as a comparison with similar homes in the area
Home Values in the Area
Average Home Value in this Area
Purchase History
| Date | Buyer | Sale Price | Title Company |
|---|---|---|---|
| Devoto Travis Francis | $145,000 | First American | |
| Murray Darren F | $85,000 | Attorney | |
| Citimortgage Inc | $86,667 | None Available | |
| Morrison | $70,500 | -- | |
| Centers & Rick L & Sue E | $35,000 | -- |
Source: Public Records
Mortgage History
| Date | Status | Borrower | Loan Amount |
|---|---|---|---|
| Open | Devoto Travis Francis | $137,700 |
Source: Public Records
Tax History
| Year | Tax Paid | Tax Assessment Tax Assessment Total Assessment is a certain percentage of the fair market value that is determined by local assessors to be the total taxable value of land and additions on the property. | Land | Improvement |
|---|---|---|---|---|
| 2025 | $3,446 | $84,410 | $14,840 | $69,570 |
| 2024 | $3,446 | $84,410 | $14,840 | $69,570 |
| 2023 | $3,039 | $69,877 | $8,295 | $61,582 |
| 2022 | $3,039 | $69,878 | $8,295 | $61,583 |
| 2021 | $2,860 | $69,878 | $8,295 | $61,583 |
| 2020 | $2,688 | $56,812 | $6,745 | $50,068 |
| 2019 | $2,491 | $56,812 | $6,745 | $50,068 |
| 2018 | $2,481 | $56,812 | $6,745 | $50,068 |
| 2017 | $2,516 | $51,671 | $6,241 | $45,430 |
| 2016 | $2,619 | $51,671 | $6,241 | $45,430 |
| 2015 | $2,472 | $51,671 | $6,241 | $45,430 |
| 2014 | $2,472 | $46,130 | $5,570 | $40,560 |
| 2013 | $2,471 | $55,820 | $6,740 | $49,080 |
Source: Public Records
Map
Nearby Homes
- 365 Fitchs Farm Ct
- 441 Ohio 73
- 441 East St Unit 73
- 7412 Larkspur Ct
- 162 E State Route 73
- 7259 State Route 48
- 5690 Bunnell Hill Rd
- 7425 Stoneham Cir
- 710 White Cedar Way
- 4870 Bunnell Hill Rd
- 472 Timber Walk Ct
- 475 Timber Walk Ct
- 678 Grand Wood Ct
- 7777 State Route 48
- 701 Grand Wood Ct
- 7545 Deer Path Ct
- 5 Woodcliff Blvd
- 10 Chestnut St
- 22 Chestnut St
- 28 Chestnut St
- 428 E Lower Springboro Rd
- 454 E Lower Springboro Rd
- 412 E Lower Springboro Rd
- 555 E Lower Springboro Rd
- 500 E Lower Springboro Rd
- 506 E Lower Springboro Rd
- 502 E Lower Springboro Rd
- 624 E Lower Springboro Rd
- 627 E Lower Springboro Rd
- 504 E Lower Springboro Rd
- 653 E Lower Springboro Rd
- 657 E Lower Springboro Rd
- 703 E Lower Springboro Rd
- 496 E Lower Springboro Rd
- 717 E Lower Springboro Rd
- 730 E Lower Springboro Rd
- 734 E Lower Springboro Rd
- 731 E Lower Springboro Rd
- 369 Woodside Trail
- 776 E Lower Springboro Rd
Your Personal Tour Guide
Ask me questions while you tour the home.