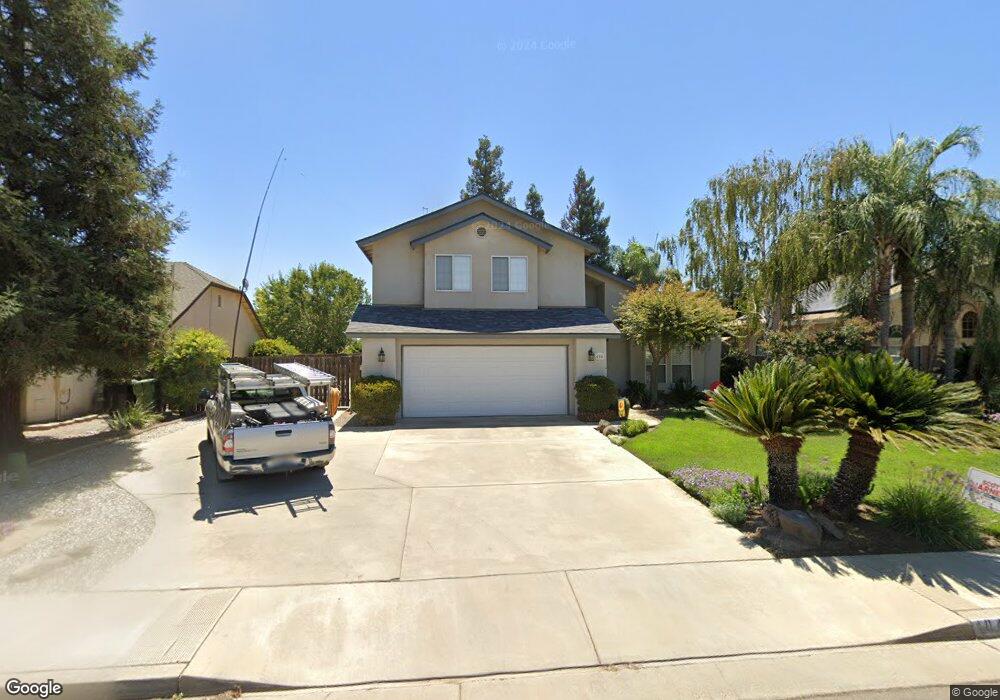
404 Euclid Cir Dinuba, CA 93618
Estimated Value: $418,742 - $460,000
3
Beds
3
Baths
2,018
Sq Ft
$218/Sq Ft
Est. Value
About This Home
This home is located at 404 Euclid Cir, Dinuba, CA 93618 and is currently estimated at $438,936, approximately $217 per square foot. 404 Euclid Cir is a home located in Tulare County with nearby schools including Roosevelt Elementary School, Washington Intermediate School, and Dinuba High School.
Ownership History
Date
Name
Owned For
Owner Type
Purchase Details
Closed on
Feb 27, 1997
Sold by
Ready Mtg Partnership #747
Bought by
Johnson Steven and Johnson Diane
Current Estimated Value
Home Financials for this Owner
Home Financials are based on the most recent Mortgage that was taken out on this home.
Original Mortgage
$104,000
Outstanding Balance
$12,488
Interest Rate
7.63%
Estimated Equity
$426,448
Purchase Details
Closed on
Feb 16, 1996
Sold by
Threlkeld Thacher and Yarbrough Donald
Bought by
Ready Mtg Partnership #747
Purchase Details
Closed on
Nov 22, 1993
Sold by
Yarbrough Marilyn
Bought by
Yarbrough Don
Home Financials for this Owner
Home Financials are based on the most recent Mortgage that was taken out on this home.
Original Mortgage
$342,000
Interest Rate
7.09%
Mortgage Type
Construction
Create a Home Valuation Report for This Property
The Home Valuation Report is an in-depth analysis detailing your home's value as well as a comparison with similar homes in the area
Home Values in the Area
Average Home Value in this Area
Purchase History
| Date | Buyer | Sale Price | Title Company |
|---|---|---|---|
| Johnson Steven | $135,000 | Fidelity National Title Co | |
| Ready Mtg Partnership #747 | $269,568 | Chicago Title Co | |
| Yarbrough Don | -- | Chicago Title Company | |
| Threlkeld Thacher | -- | Chicago Title Company |
Source: Public Records
Mortgage History
| Date | Status | Borrower | Loan Amount |
|---|---|---|---|
| Open | Johnson Steven | $104,000 | |
| Previous Owner | Threlkeld Thacher | $342,000 |
Source: Public Records
Tax History
| Year | Tax Paid | Tax Assessment Tax Assessment Total Assessment is a certain percentage of the fair market value that is determined by local assessors to be the total taxable value of land and additions on the property. | Land | Improvement |
|---|---|---|---|---|
| 2025 | $2,595 | $235,839 | $48,859 | $186,980 |
| 2024 | $2,595 | $231,215 | $47,901 | $183,314 |
| 2023 | $2,566 | $226,682 | $46,962 | $179,720 |
| 2022 | $2,450 | $222,239 | $46,042 | $176,197 |
| 2021 | $2,390 | $217,881 | $45,139 | $172,742 |
| 2020 | $2,430 | $215,647 | $44,676 | $170,971 |
| 2019 | $2,459 | $211,419 | $43,800 | $167,619 |
| 2018 | $2,381 | $207,273 | $42,941 | $164,332 |
| 2017 | $2,365 | $203,209 | $42,099 | $161,110 |
| 2016 | $2,254 | $199,225 | $41,274 | $157,951 |
| 2015 | $1,958 | $196,232 | $40,654 | $155,578 |
| 2014 | $1,958 | $173,000 | $43,000 | $130,000 |
Source: Public Records
Map
Nearby Homes
- 1306 Country Place
- 1755 W Rosemary Ave Unit Mb65
- 1755 W Rosemary Ave Unit Lot 65
- 1695 W Rosemary Ave Unit Lot 61
- 337 Village Dr
- 346 Village Dr
- 900 Heather Ave
- 755 Lilac Ln
- 862 N Bates Ave
- 7301 Avenue 424
- 683 N Villa Ave
- 1250 N Mckinley Ct
- 456 N Smith Ave
- 435 N Alta Ave
- 1476 Crimson Way
- 0 E Sequoia Dr
- 239 W Adelaide Way
- 1449 Crimson Way
- 372 N Smith Ave
- 1695 Rosemary Ave Unit Mb61
- 430 Euclid Cir
- 382 Euclid Cir
- 360 Euclid Cir
- 452 Euclid Cir
- 338 Euclid Cir
- 461 Euclid Cir
- 474 Euclid Cir
- 409 Euclid Cir
- 435 Euclid Cir
- 387 Euclid Cir
- 487 Euclid Cir
- 365 Euclid Cir
- 316 Euclid Cir
- 343 Euclid Cir
- 1642 N Euclid Ave
- 321 Euclid Cir
- 1422 N Euclid Ave
- 1422 N Euclid Rd N
- 1511 N Euclid Ave
- 1565 N Euclid Ave
Your Personal Tour Guide
Ask me questions while you tour the home.