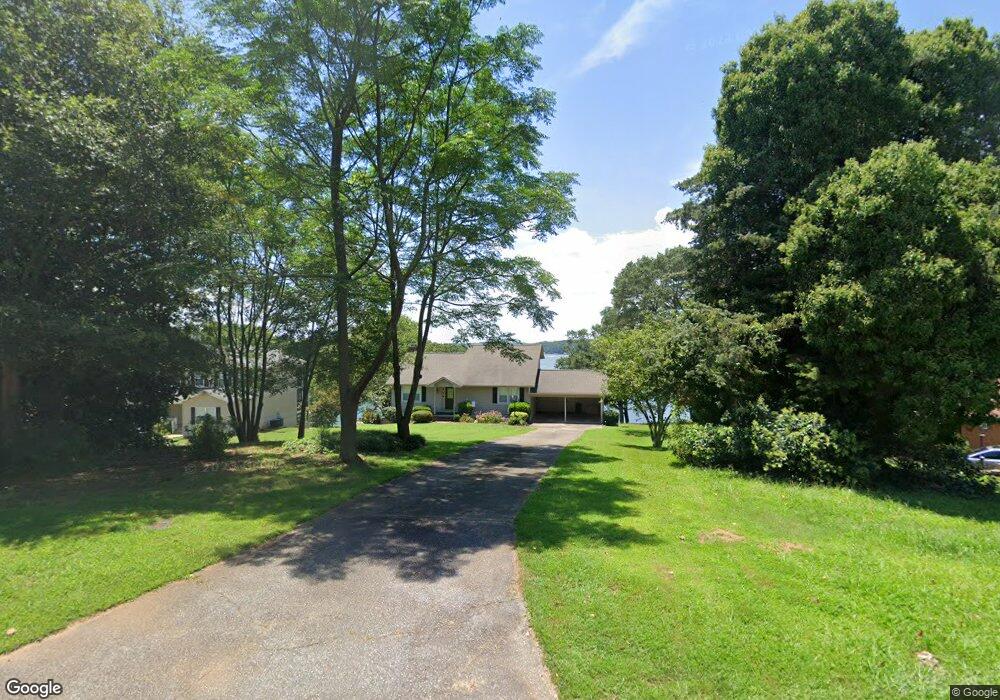
404 Hartview Cir Anderson, SC 29625
Estimated Value: $565,000 - $712,000
3
Beds
3
Baths
2,798
Sq Ft
$230/Sq Ft
Est. Value
About This Home
This home is located at 404 Hartview Cir, Anderson, SC 29625 and is currently estimated at $643,522, approximately $229 per square foot. 404 Hartview Cir is a home located in Anderson County with nearby schools including New Prospect Elementary School, Robert Anderson Middle School, and Westside High School.
Ownership History
Date
Name
Owned For
Owner Type
Purchase Details
Closed on
Dec 21, 2020
Sold by
Vanchoff Scott Anthony and Vanchoff Sherry Marie
Bought by
Vanchoff Scott Anthony and Vanchoff Sherry Marie
Current Estimated Value
Home Financials for this Owner
Home Financials are based on the most recent Mortgage that was taken out on this home.
Original Mortgage
$335,000
Outstanding Balance
$298,250
Interest Rate
2.7%
Mortgage Type
New Conventional
Estimated Equity
$345,272
Purchase Details
Closed on
Aug 21, 2015
Sold by
Whatley Charles E and Whatley Deborah H
Bought by
Whatley Charles E and Whatley Deborah H
Purchase Details
Closed on
Feb 25, 2009
Sold by
Vandiver W F and Vandiver Rebecca N
Bought by
Whatley Charles E and Whatley Deborah H
Home Financials for this Owner
Home Financials are based on the most recent Mortgage that was taken out on this home.
Original Mortgage
$295,000
Interest Rate
5.03%
Mortgage Type
Purchase Money Mortgage
Create a Home Valuation Report for This Property
The Home Valuation Report is an in-depth analysis detailing your home's value as well as a comparison with similar homes in the area
Home Values in the Area
Average Home Value in this Area
Purchase History
| Date | Buyer | Sale Price | Title Company |
|---|---|---|---|
| Vanchoff Scott Anthony | -- | None Available | |
| Vanchoff Scott Anthony | $420,000 | None Available | |
| Whatley Charles E | -- | -- | |
| Whatley Charles E | $370,000 | -- | |
| Bush Allen | $75,000 | -- |
Source: Public Records
Mortgage History
| Date | Status | Borrower | Loan Amount |
|---|---|---|---|
| Open | Vanchoff Scott Anthony | $335,000 | |
| Previous Owner | Whatley Charles E | $295,000 |
Source: Public Records
Tax History Compared to Growth
Tax History
| Year | Tax Paid | Tax Assessment Tax Assessment Total Assessment is a certain percentage of the fair market value that is determined by local assessors to be the total taxable value of land and additions on the property. | Land | Improvement |
|---|---|---|---|---|
| 2024 | $7,673 | $26,490 | $12,280 | $14,210 |
| 2023 | $7,673 | $26,490 | $12,280 | $14,210 |
| 2022 | $7,451 | $26,490 | $12,280 | $14,210 |
| 2021 | $6,756 | $22,730 | $11,160 | $11,570 |
| 2020 | $6,655 | $22,730 | $11,160 | $11,570 |
| 2019 | $6,655 | $22,730 | $11,160 | $11,570 |
| 2018 | $6,564 | $22,730 | $11,160 | $11,570 |
| 2017 | -- | $22,730 | $11,160 | $11,570 |
| 2016 | $6,172 | $19,690 | $7,800 | $11,890 |
| 2015 | $6,232 | $19,690 | $7,800 | $11,890 |
| 2014 | $6,137 | $19,690 | $7,800 | $11,890 |
Source: Public Records
Map
Nearby Homes
- 104 Midway Dr
- 323 Lake Forest Cir
- 1308 Lakewood Ln
- 7.62 Acs Phillips Rd
- 712 Whitney Way
- 1025 Phillips Rd
- 217 Shady Ln
- 303 Plantation Point
- 125 Maffett Cir
- 100 Grandview Dr
- 104 Pawleys Ct
- 0 Centerville Rd
- 118 Pritchards Dr
- Lot 113 Hidden Lake Dr
- 105 Cliftons Landing Dr
- 125 Hidden Lake Dr
- 2214 Surfside Dr
- 208 Springview Dr
- Lot 7 Valley Dale Dr
- 1511 Cherokee Cir
- 406 Hartview Cir
- 402 Hartview Cir
- 0 Hartview Cir
- 410 Hartview Cir
- 342 Hartview Cir
- 407 Hartview Cir
- 407 Hartview Cir Unit Anderson
- 338 Hartview Cir
- 323 Hartview Cir
- 411 Hartview Cir
- 418 Hartview Cir
- 334 Hartview Cir
- 415 Hartview Cir
- 422 Hartview Cir
- 330 Hartview Cir
- 139 Midway Dr
- 129 Midway Dr
- 127 Midway Dr
- 326 Hartview Cir
- 125 Midway Dr