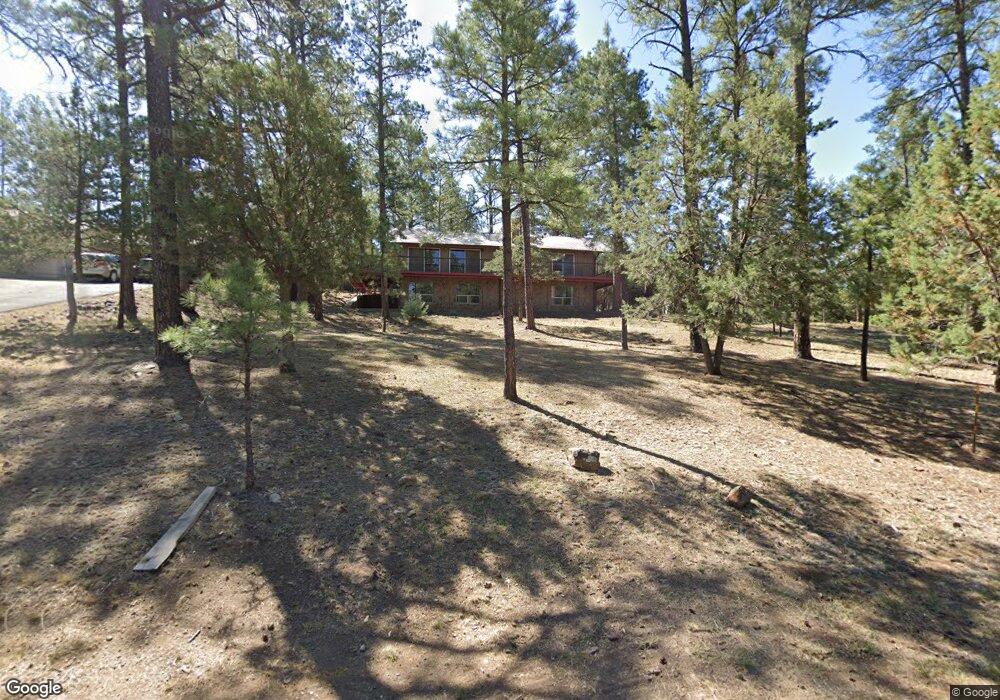
404 High Loop Dr Ruidoso, NM 88345
Estimated Value: $635,000
4
Beds
2
Baths
2,700
Sq Ft
$235/Sq Ft
Est. Value
About This Home
This home is located at 404 High Loop Dr, Ruidoso, NM 88345 and is currently estimated at $635,000, approximately $235 per square foot. 404 High Loop Dr is a home located in Lincoln County with nearby schools including Sierra Vista Primary School, White Mountain Elementary School, and Ruidoso Middle School.
Ownership History
Date
Name
Owned For
Owner Type
Purchase Details
Closed on
May 1, 2017
Sold by
Gbnb Management Holdings Lp
Bought by
Kubacak Greg and Kubacak Cheryl
Current Estimated Value
Purchase Details
Closed on
Apr 25, 2017
Sold by
Bell Janice M
Bought by
Bell Drake K and Bell Karla Marie
Purchase Details
Closed on
Apr 11, 2017
Sold by
Drake Drake K and Drake Jeff
Bought by
Gbnb Management Holdings Lp
Purchase Details
Closed on
Dec 15, 2010
Sold by
Bell Realty Company Inc
Bought by
Gbnb Management Holdings Lp
Purchase Details
Closed on
Oct 9, 2009
Sold by
Bell Realty Co and Drake K M
Bought by
Gbnb Management Holdings Lp
Purchase Details
Closed on
Oct 1, 2009
Sold by
Bell Realty Company Inc
Bought by
Gbnb Management Holdings Lp
Purchase Details
Closed on
Feb 22, 2007
Sold by
Bell Realty Co
Bought by
Karia Bell Trust
Create a Home Valuation Report for This Property
The Home Valuation Report is an in-depth analysis detailing your home's value as well as a comparison with similar homes in the area
Home Values in the Area
Average Home Value in this Area
Purchase History
| Date | Buyer | Sale Price | Title Company |
|---|---|---|---|
| Kubacak Greg | -- | None Available | |
| Bell Drake K | -- | None Available | |
| Gbnb Management Holdings Lp | -- | None Available | |
| Gbnb Management Holdings Lp | -- | None Available | |
| Gbnb Management Holdings Lp | -- | None Available | |
| Gbnb Management Holdings Lp | -- | None Available | |
| Karia Bell Trust | -- | None Available |
Source: Public Records
Tax History
| Year | Tax Paid | Tax Assessment Tax Assessment Total Assessment is a certain percentage of the fair market value that is determined by local assessors to be the total taxable value of land and additions on the property. | Land | Improvement |
|---|---|---|---|---|
| 2025 | $3,362 | $111,109 | $27,019 | $84,090 |
| 2024 | $3,160 | $107,873 | $26,232 | $81,641 |
| 2023 | $3,160 | $104,731 | $25,468 | $79,263 |
| 2022 | $3,276 | $101,680 | $24,726 | $76,954 |
| 2021 | $2,970 | $98,710 | $24,004 | $74,706 |
| 2020 | $2,815 | $92,707 | $23,305 | $69,402 |
| 2019 | $2,634 | $90,889 | $22,848 | $68,041 |
| 2018 | $2,542 | $88,241 | $22,182 | $66,059 |
| 2017 | $2,446 | $85,672 | $21,536 | $64,136 |
| 2015 | $2,380 | $83,185 | $20,911 | $62,274 |
| 2014 | $2,311 | $80,762 | $20,302 | $60,460 |
Source: Public Records
Map
Nearby Homes
- 407 High Loop Dr
- 105 High Loop Dr
- 204 Hull Rd
- 208 High Loop Dr
- 105 White Oaks Rd
- 111 Poco Loco Dr
- 104 Torreon Loop
- 118 Coronado Dr
- 99 Kirkman Dr
- 112 Coronado Dr
- 114 Coronado Dr
- 306 Barcus Rd
- 217 Barcus Rd
- 100 Heath Dr
- 110 Bogie Ln Unit 3C
- 110 Bogie Ln Unit 3A
- 409 Barcus Rd
- 113 Bogie Ln Unit 17
- 113 Bogie Ln Unit 21
- 471 Paradise Canyon Dr
Your Personal Tour Guide
Ask me questions while you tour the home.