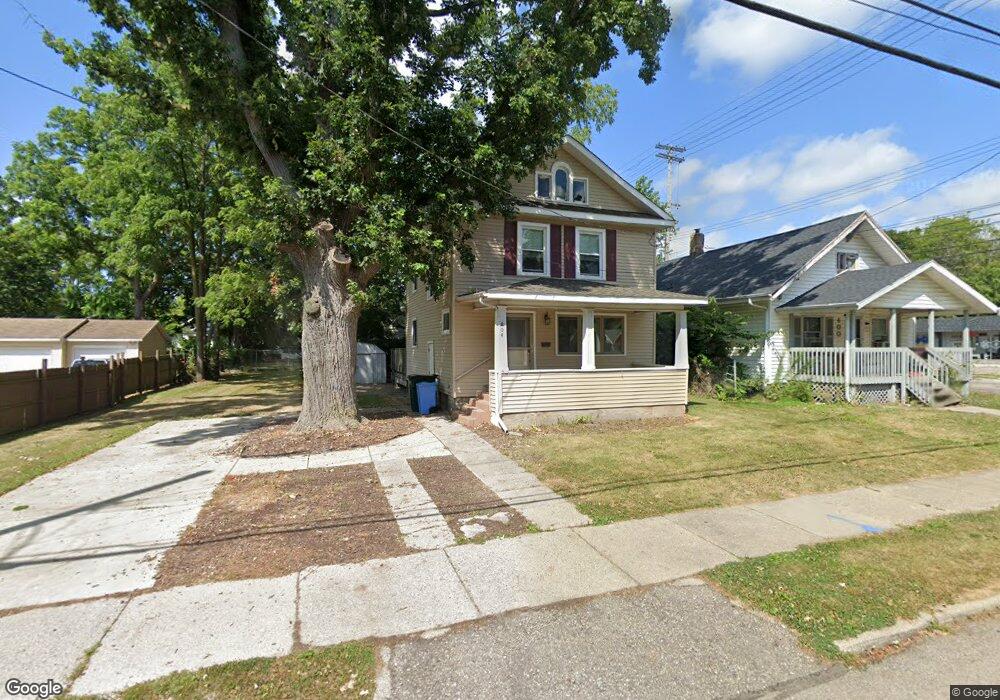
404 Leslie St Lansing, MI 48912
Fairview Area NeighborhoodEstimated Value: $104,000 - $126,170
--
Bed
--
Bath
1,152
Sq Ft
$101/Sq Ft
Est. Value
About This Home
This home is located at 404 Leslie St, Lansing, MI 48912 and is currently estimated at $116,793, approximately $101 per square foot. 404 Leslie St is a home located in Ingham County with nearby schools including Pattengill Academy, Riddle Elementary School, and Eastern High School.
Ownership History
Date
Name
Owned For
Owner Type
Purchase Details
Closed on
May 3, 2019
Sold by
Spitzley Alex A and Spitzley Joan R
Bought by
Spitzley Michael K and Spitzley Renee S
Current Estimated Value
Home Financials for this Owner
Home Financials are based on the most recent Mortgage that was taken out on this home.
Original Mortgage
$63,675
Outstanding Balance
$55,755
Interest Rate
4%
Mortgage Type
Future Advance Clause Open End Mortgage
Estimated Equity
$61,038
Purchase Details
Closed on
Aug 9, 2013
Sold by
Ingham County
Bought by
Spitzley Alex A and Spitzley Joan R
Purchase Details
Closed on
Jan 21, 2003
Sold by
Otis Gary L and Otis Lola B
Bought by
Ray Randy and Ray Beverly J
Purchase Details
Closed on
May 15, 1996
Sold by
Otis Gary L and Otis Lola B
Bought by
Ray Randy and Ray Beverly J
Create a Home Valuation Report for This Property
The Home Valuation Report is an in-depth analysis detailing your home's value as well as a comparison with similar homes in the area
Home Values in the Area
Average Home Value in this Area
Purchase History
| Date | Buyer | Sale Price | Title Company |
|---|---|---|---|
| Spitzley Michael K | $59,000 | Liberty Title | |
| Spitzley Alex A | $15,500 | None Available | |
| Ray Randy | $25,416 | -- | |
| Ray Randy | $27,000 | -- |
Source: Public Records
Mortgage History
| Date | Status | Borrower | Loan Amount |
|---|---|---|---|
| Open | Spitzley Michael K | $63,675 |
Source: Public Records
Tax History Compared to Growth
Tax History
| Year | Tax Paid | Tax Assessment Tax Assessment Total Assessment is a certain percentage of the fair market value that is determined by local assessors to be the total taxable value of land and additions on the property. | Land | Improvement |
|---|---|---|---|---|
| 2025 | $3,186 | $59,700 | $6,300 | $53,400 |
| 2024 | $26 | $52,800 | $6,300 | $46,500 |
| 2023 | $2,998 | $43,500 | $6,300 | $37,200 |
| 2022 | $2,737 | $36,400 | $5,000 | $31,400 |
| 2021 | $2,673 | $34,200 | $5,600 | $28,600 |
| 2020 | $2,594 | $32,000 | $5,600 | $26,400 |
| 2019 | $2,200 | $27,400 | $5,600 | $21,800 |
| 2018 | $2,087 | $27,100 | $5,600 | $21,500 |
| 2017 | $2,008 | $27,100 | $5,600 | $21,500 |
| 2016 | $2,258 | $26,700 | $5,600 | $21,100 |
| 2015 | $2,258 | $25,900 | $11,271 | $14,629 |
| 2014 | $2,258 | $25,700 | $11,271 | $14,429 |
Source: Public Records
Map
Nearby Homes
- 424 S Clemens Ave
- 329 S Clemens Ave
- 222 S Clemens Ave
- 607 Shepard St Unit 2
- 207 Allen St
- 400 Lathrop St
- 515 S Clemens Ave
- 619 Shepard St
- 528 S Fairview Ave
- 523 Clifford St
- V/L E Kalamazoo St
- 637 S Clemens Ave
- 129 Clifford St
- 404 S Hayford Ave
- 412 S Hayford Ave
- 1346 Eureka St
- 701 S Fairview Ave
- 624 S Hayford Ave
- 309 & 311 S Holmes St
- 426 S Francis Ave