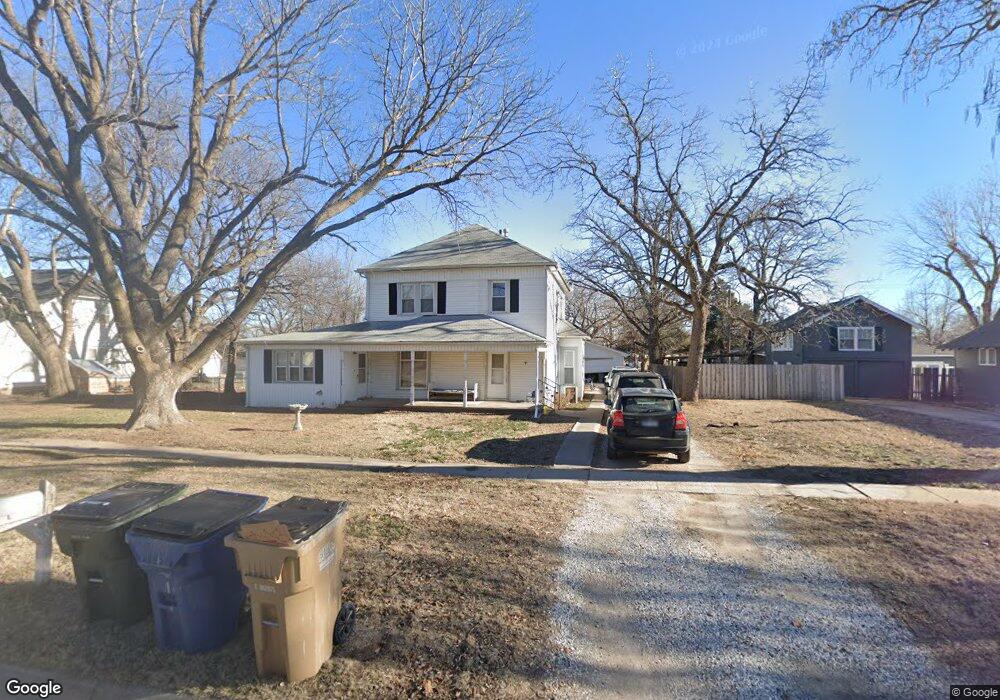
404 N Peabody St Nickerson, KS 67561
Estimated Value: $90,000 - $151,188
4
Beds
3
Baths
2,138
Sq Ft
$54/Sq Ft
Est. Value
About This Home
This home is located at 404 N Peabody St, Nickerson, KS 67561 and is currently estimated at $116,396, approximately $54 per square foot. 404 N Peabody St is a home located in Reno County with nearby schools including Nickerson High School.
Ownership History
Date
Name
Owned For
Owner Type
Purchase Details
Closed on
May 1, 2004
Bought by
Henderson Matthew W and Henderson Corrine N
Current Estimated Value
Create a Home Valuation Report for This Property
The Home Valuation Report is an in-depth analysis detailing your home's value as well as a comparison with similar homes in the area
Home Values in the Area
Average Home Value in this Area
Purchase History
| Date | Buyer | Sale Price | Title Company |
|---|---|---|---|
| Henderson Matthew W | $66,000 | -- |
Source: Public Records
Tax History Compared to Growth
Tax History
| Year | Tax Paid | Tax Assessment Tax Assessment Total Assessment is a certain percentage of the fair market value that is determined by local assessors to be the total taxable value of land and additions on the property. | Land | Improvement |
|---|---|---|---|---|
| 2024 | $2,217 | $11,201 | $738 | $10,463 |
| 2023 | $2,257 | $11,435 | $642 | $10,793 |
| 2022 | $1,756 | $9,449 | $624 | $8,825 |
| 2021 | $1,706 | $8,769 | $555 | $8,214 |
| 2020 | $1,766 | $8,577 | $555 | $8,022 |
| 2019 | $1,705 | $8,683 | $511 | $8,172 |
| 2018 | $1,678 | $8,648 | $469 | $8,179 |
| 2017 | $1,640 | $8,108 | $482 | $7,626 |
| 2016 | $1,646 | $8,211 | $482 | $7,729 |
| 2015 | $1,610 | $8,142 | $419 | $7,723 |
| 2014 | $1,478 | $7,636 | $419 | $7,217 |
Source: Public Records
Map
Nearby Homes
- 400 N Speare St
- 9120 N Riverton Rd
- 0000 W 95th Ave
- 10702 W 95th Ave
- 6310 N Dean Rd
- 1 Avenue Y
- 4511 N Wilson Rd
- 61 Willowbrook St
- 2100 25th Rd
- 1 18th Rd
- 2020 W 56th Ave
- 2010 W 56th Ave
- 0000 Wovoka Dr
- 000 Paganica Pass
- 0000 Dull Knife Dr
- 0000 E Snokomo Rd
- 000 E Snokomo Rd
- 1200 W 43rd Ave
- 522 E Main St
- 00000 Dull Knife Rd
- 410 N Peabody St
- 400 N Peabody St
- 407 N Nickerson St
- 411 N Nickerson St
- 401 N Nickerson St
- 405 N Peabody St
- 403 N Peabody St
- 310 N Peabody St
- 6 W F Ave
- 502 N Peabody St
- 6 W Avenue F
- 501 N Nickerson St
- 315 N Nickerson St
- 5701 N Nickerson St
- 308 N Peabody St
- 501 N Peabody St
- 311 N Peabody St
- 406 N Burr St
- 107 W Avenue F
- 505 N Nickerson St