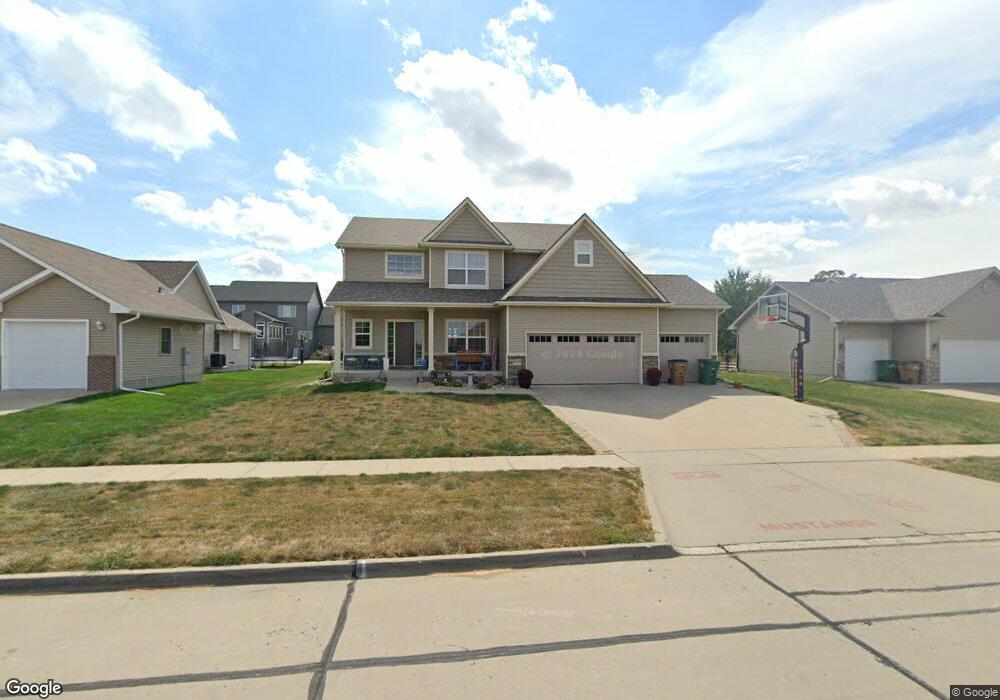
404 NW 14th St Grimes, IA 50111
Estimated Value: $460,000 - $492,000
4
Beds
4
Baths
2,445
Sq Ft
$196/Sq Ft
Est. Value
About This Home
This home is located at 404 NW 14th St, Grimes, IA 50111 and is currently estimated at $479,949, approximately $196 per square foot. 404 NW 14th St is a home located in Polk County with nearby schools including North Ridge Elementary School, Dallas Center-Grimes Middle School, and Dallas Center - Grimes High School.
Ownership History
Date
Name
Owned For
Owner Type
Purchase Details
Closed on
Jun 8, 2015
Sold by
Hubbell Metropolitan Development Fund I
Bought by
Destiny Homes Llc
Current Estimated Value
Purchase Details
Closed on
Nov 2, 2007
Sold by
Countryside Leasing Lc
Bought by
Scholl Justin M and Scholl Katherine A
Home Financials for this Owner
Home Financials are based on the most recent Mortgage that was taken out on this home.
Original Mortgage
$24,218
Interest Rate
6.45%
Mortgage Type
Purchase Money Mortgage
Purchase Details
Closed on
Aug 3, 2007
Sold by
Regency Land Co Lc
Bought by
Countryside Leasing Lc
Home Financials for this Owner
Home Financials are based on the most recent Mortgage that was taken out on this home.
Original Mortgage
$216,000
Interest Rate
6.71%
Mortgage Type
Construction
Purchase Details
Closed on
Jul 19, 2005
Sold by
Beaverbrooke Development Co
Bought by
Regency Land Co Lc
Create a Home Valuation Report for This Property
The Home Valuation Report is an in-depth analysis detailing your home's value as well as a comparison with similar homes in the area
Home Values in the Area
Average Home Value in this Area
Purchase History
| Date | Buyer | Sale Price | Title Company |
|---|---|---|---|
| Destiny Homes Llc | $49,500 | None Available | |
| Scholl Justin M | $241,500 | Itc | |
| Countryside Leasing Lc | $42,000 | None Available | |
| Regency Land Co Lc | $37,500 | -- |
Source: Public Records
Mortgage History
| Date | Status | Borrower | Loan Amount |
|---|---|---|---|
| Previous Owner | Scholl Justin M | $24,218 | |
| Previous Owner | Scholl Justin M | $193,939 | |
| Previous Owner | Countryside Leasing Lc | $216,000 |
Source: Public Records
Tax History Compared to Growth
Tax History
| Year | Tax Paid | Tax Assessment Tax Assessment Total Assessment is a certain percentage of the fair market value that is determined by local assessors to be the total taxable value of land and additions on the property. | Land | Improvement |
|---|---|---|---|---|
| 2025 | $8,598 | $487,300 | $65,000 | $422,300 |
| 2024 | $8,598 | $470,400 | $61,800 | $408,600 |
| 2023 | $7,776 | $470,400 | $61,800 | $408,600 |
| 2022 | $7,826 | $363,100 | $49,100 | $314,000 |
| 2021 | $7,650 | $363,100 | $49,100 | $314,000 |
| 2020 | $7,528 | $343,600 | $46,400 | $297,200 |
| 2019 | $7,282 | $343,600 | $46,400 | $297,200 |
| 2018 | $6,930 | $312,200 | $41,300 | $270,900 |
| 2017 | $6,544 | $288,300 | $41,300 | $247,000 |
| 2016 | $6,268 | $266,300 | $37,600 | $228,700 |
| 2015 | $6,268 | $266,300 | $37,600 | $228,700 |
| 2014 | $5,420 | $235,000 | $33,000 | $202,000 |
Source: Public Records
Map
Nearby Homes
- 406 NW Beaverbrooke Blvd
- 1217 NW Morningside Ct
- 1704 NW Norton Ct
- 1609 NW Prairie Creek Dr
- 1109 NW Gabus Cir
- 1716 NW Calista St
- 1716 NW Prairie Creek Dr
- 1901 NW Prairie Creek Dr
- 108 NW 10th Cir
- 512 NW 10th Cir
- 2100 NW Prairie Creek Dr
- 2215 NW Gabus Dr
- 411 NW 7th St
- 604 NW 8th St
- 107 NW 7th None
- 1424 NE Poplar Ct
- 1420 Poplar St
- 604 NW Calista Ct
- 701 NE Lakeview Dr
- 1413 NE Park St
- 400 NW 14th St
- 405 NW 13th St
- 409 NW 13th St
- 401 NW 13th St
- 401 NW 14th St
- 409 NW 14th St
- 412 NW 14th St
- 405 NW 14th St
- 501 NW 13th St
- 308 NW 14th St
- 1400 NW Calista St
- 1501 NW Calista St
- 505 NW 13th St
- 309 NW 14th St
- 1404 NW Calista St
- 404 NW 13th St
- 408 NW 13th St
- 400 NW 13th St
- 1505 NW Calista St