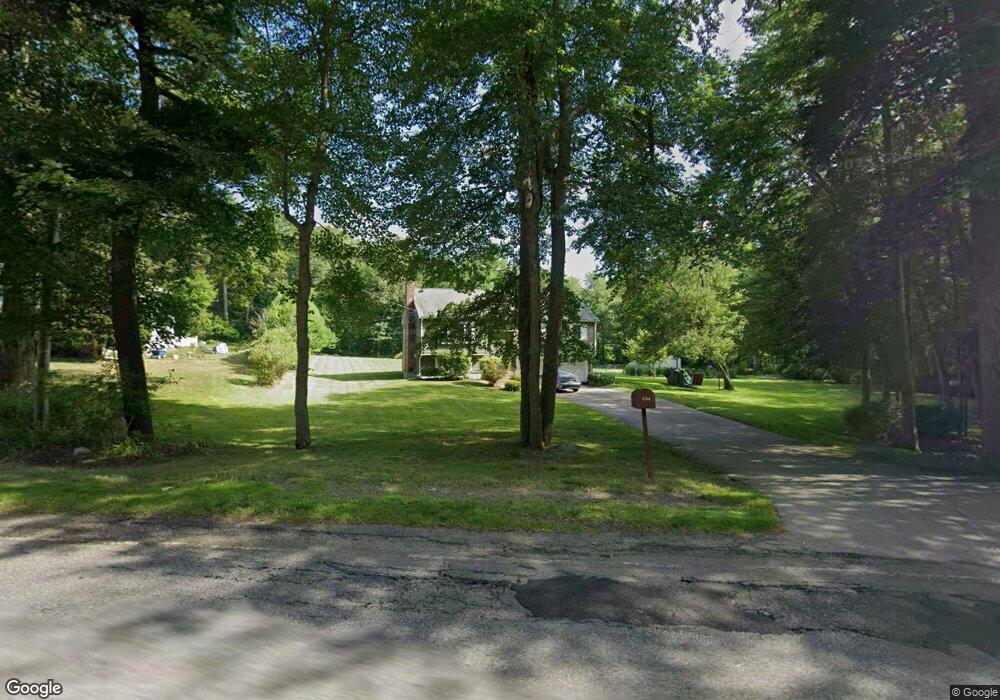
404 Oldham St Pembroke, MA 02359
Estimated Value: $501,000 - $616,000
3
Beds
2
Baths
1,132
Sq Ft
$500/Sq Ft
Est. Value
About This Home
This home is located at 404 Oldham St, Pembroke, MA 02359 and is currently estimated at $565,630, approximately $499 per square foot. 404 Oldham St is a home located in Plymouth County with nearby schools including Pembroke High School and Cardinal Cushing Centers.
Ownership History
Date
Name
Owned For
Owner Type
Purchase Details
Closed on
Aug 31, 2020
Sold by
Angellis David M and Angellis Nancy E
Bought by
Angellis Ft
Current Estimated Value
Purchase Details
Closed on
Aug 16, 1985
Bought by
Angellis David M and Angellis Nancy E
Create a Home Valuation Report for This Property
The Home Valuation Report is an in-depth analysis detailing your home's value as well as a comparison with similar homes in the area
Home Values in the Area
Average Home Value in this Area
Purchase History
| Date | Buyer | Sale Price | Title Company |
|---|---|---|---|
| Angellis Ft | -- | None Available | |
| Angellis David M | $112,500 | -- |
Source: Public Records
Mortgage History
| Date | Status | Borrower | Loan Amount |
|---|---|---|---|
| Previous Owner | Angellis David M | $63,500 | |
| Previous Owner | Angellis David M | $21,000 |
Source: Public Records
Tax History Compared to Growth
Tax History
| Year | Tax Paid | Tax Assessment Tax Assessment Total Assessment is a certain percentage of the fair market value that is determined by local assessors to be the total taxable value of land and additions on the property. | Land | Improvement |
|---|---|---|---|---|
| 2025 | $6,452 | $536,800 | $307,500 | $229,300 |
| 2024 | $6,370 | $529,500 | $302,300 | $227,200 |
| 2023 | $6,224 | $489,300 | $277,500 | $211,800 |
| 2022 | $5,786 | $408,900 | $231,700 | $177,200 |
| 2021 | $5,718 | $392,200 | $221,700 | $170,500 |
| 2020 | $5,625 | $388,200 | $216,900 | $171,300 |
| 2019 | $5,415 | $370,900 | $206,800 | $164,100 |
| 2018 | $5,366 | $360,400 | $201,600 | $158,800 |
| 2017 | $5,302 | $351,100 | $191,600 | $159,500 |
| 2016 | $5,140 | $336,800 | $179,200 | $157,600 |
| 2015 | $4,437 | $301,000 | $171,600 | $129,400 |
Source: Public Records
Map
Nearby Homes