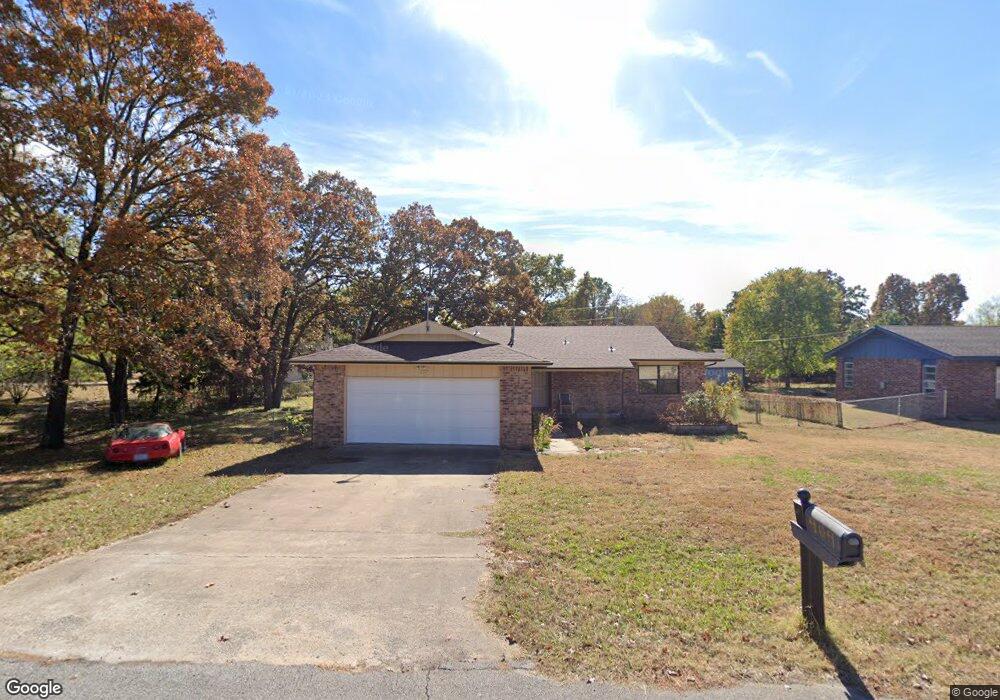
404 Pat St Tahlequah, OK 74464
Estimated Value: $163,064 - $204,000
3
Beds
2
Baths
1,292
Sq Ft
$146/Sq Ft
Est. Value
About This Home
This home is located at 404 Pat St, Tahlequah, OK 74464 and is currently estimated at $188,016, approximately $145 per square foot. 404 Pat St is a home located in Cherokee County with nearby schools including Cherokee Elementary School, Greenwood Elementary School, and Tahlequah Middle School.
Ownership History
Date
Name
Owned For
Owner Type
Purchase Details
Closed on
Jun 27, 2020
Sold by
Pallie Sandra
Bought by
Pallie Sandra and Pallie Jonathan Rafi
Current Estimated Value
Purchase Details
Closed on
Feb 24, 2009
Sold by
Pallie Sandra
Bought by
Cherokee Nation
Purchase Details
Closed on
Jul 25, 2005
Sold by
Jones Justin D and Jones Darcy Marie
Bought by
Pallie Sandra
Home Financials for this Owner
Home Financials are based on the most recent Mortgage that was taken out on this home.
Original Mortgage
$67,200
Interest Rate
5.61%
Mortgage Type
New Conventional
Purchase Details
Closed on
Mar 23, 1999
Sold by
Lori Marcus T and Lori Enlow
Bought by
Justin D Jones
Purchase Details
Closed on
Aug 18, 1997
Sold by
Scott D Qualls
Bought by
Lori Marcus T and Lori Enlow
Purchase Details
Closed on
Jan 28, 1994
Sold by
Rita E Porterfield
Bought by
Qualls Scott D and Qualls Carla R
Create a Home Valuation Report for This Property
The Home Valuation Report is an in-depth analysis detailing your home's value as well as a comparison with similar homes in the area
Home Values in the Area
Average Home Value in this Area
Purchase History
| Date | Buyer | Sale Price | Title Company |
|---|---|---|---|
| Pallie Sandra | -- | None Available | |
| Cherokee Nation | $26,703 | None Available | |
| Pallie Sandra | $90,000 | None Available | |
| Justin D Jones | $78,000 | -- | |
| Lori Marcus T | $60,500 | -- | |
| Qualls Scott D | $55,000 | -- |
Source: Public Records
Mortgage History
| Date | Status | Borrower | Loan Amount |
|---|---|---|---|
| Previous Owner | Pallie Sandra | $67,200 |
Source: Public Records
Tax History Compared to Growth
Tax History
| Year | Tax Paid | Tax Assessment Tax Assessment Total Assessment is a certain percentage of the fair market value that is determined by local assessors to be the total taxable value of land and additions on the property. | Land | Improvement |
|---|---|---|---|---|
| 2025 | $1,025 | $12,169 | $2,374 | $9,795 |
| 2024 | $1,025 | $11,814 | $2,305 | $9,509 |
| 2023 | $1,025 | $11,470 | $2,238 | $9,232 |
| 2022 | $940 | $11,136 | $1,904 | $9,232 |
| 2021 | $914 | $10,812 | $1,580 | $9,232 |
| 2020 | $900 | $10,497 | $1,265 | $9,232 |
| 2019 | $892 | $10,497 | $1,265 | $9,232 |
| 2018 | $954 | $11,037 | $1,265 | $9,772 |
| 2017 | $922 | $10,716 | $1,265 | $9,451 |
| 2016 | $898 | $10,404 | $1,265 | $9,139 |
| 2015 | $854 | $10,101 | $1,265 | $8,836 |
| 2014 | $829 | $9,807 | $1,265 | $8,542 |
Source: Public Records
Map
Nearby Homes
- 402 Pat St
- 408 Pat St
- 307 Kim St
- 405 Kim St
- 400 Pat St
- 421 Pat St
- 431 Pat St
- 0 Oklahoma Ave Unit 2420701
- 0 Oklahoma Ave Unit 2343075
- 0 Oklahoma Ave Unit 1629068
- 0 Oklahoma Ave Unit 1629064
- 0 Oklahoma Ave Unit 1604218
- 0 Oklahoma Ave Unit 1604215
- 0 Oklahoma Ave Unit 1539177
- 0 Oklahoma Ave Unit 1539196
- 305 Kim St
- 2208 N Oklahoma Ave
- 2202 N Oklahoma Ave
- 2206 Brenda Ave
- 2204 Brenda Ave