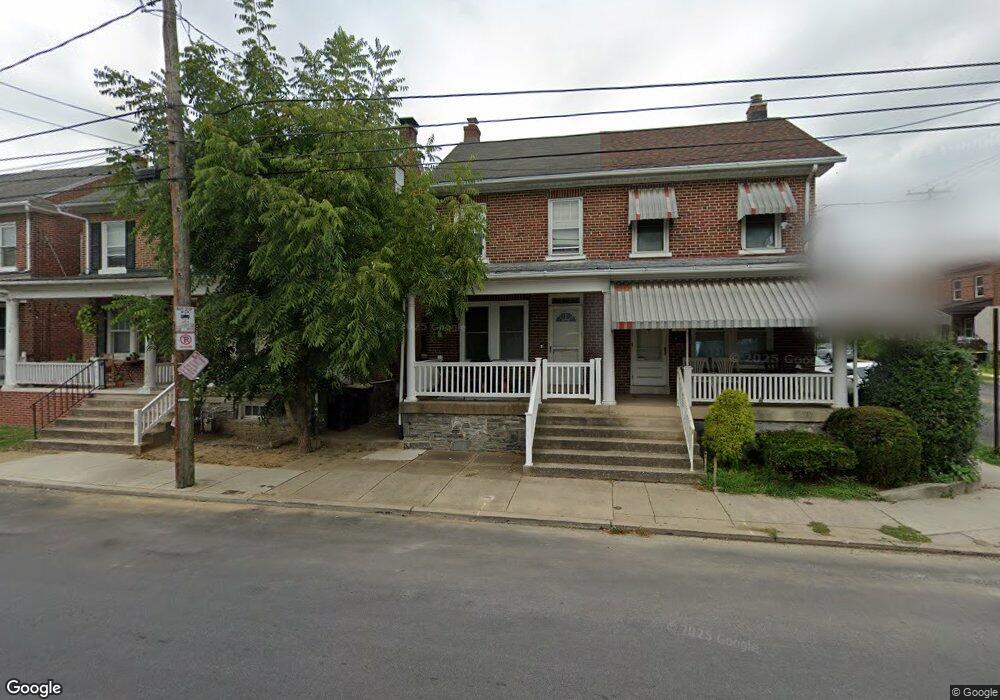
404 Ruby St Lancaster, PA 17603
West End NeighborhoodEstimated Value: $139,000 - $221,000
4
Beds
1
Bath
1,248
Sq Ft
$157/Sq Ft
Est. Value
About This Home
This home is located at 404 Ruby St, Lancaster, PA 17603 and is currently estimated at $196,501, approximately $157 per square foot. 404 Ruby St is a home located in Lancaster County with nearby schools including Smith-Wade-El Elementary School, Wheatland Middle School, and McCaskey High School.
Ownership History
Date
Name
Owned For
Owner Type
Purchase Details
Closed on
Jan 3, 2006
Sold by
The Estate Of Earl E Miller
Bought by
Johnson Victoria L
Current Estimated Value
Home Financials for this Owner
Home Financials are based on the most recent Mortgage that was taken out on this home.
Original Mortgage
$58,916
Outstanding Balance
$33,135
Interest Rate
6.28%
Mortgage Type
Fannie Mae Freddie Mac
Estimated Equity
$163,366
Create a Home Valuation Report for This Property
The Home Valuation Report is an in-depth analysis detailing your home's value as well as a comparison with similar homes in the area
Home Values in the Area
Average Home Value in this Area
Purchase History
| Date | Buyer | Sale Price | Title Company |
|---|---|---|---|
| Johnson Victoria L | $73,645 | Landamerica Commonwealth |
Source: Public Records
Mortgage History
| Date | Status | Borrower | Loan Amount |
|---|---|---|---|
| Open | Johnson Victoria L | $58,916 |
Source: Public Records
Tax History
| Year | Tax Paid | Tax Assessment Tax Assessment Total Assessment is a certain percentage of the fair market value that is determined by local assessors to be the total taxable value of land and additions on the property. | Land | Improvement |
|---|---|---|---|---|
| 2025 | $3,363 | $85,000 | $17,500 | $67,500 |
| 2024 | $3,363 | $85,000 | $17,500 | $67,500 |
| 2023 | $3,307 | $85,000 | $17,500 | $67,500 |
| 2022 | $3,169 | $85,000 | $17,500 | $67,500 |
| 2021 | $3,101 | $85,000 | $17,500 | $67,500 |
| 2020 | $3,101 | $85,000 | $17,500 | $67,500 |
| 2019 | $3,055 | $85,000 | $17,500 | $67,500 |
| 2018 | $1,376 | $85,000 | $17,500 | $67,500 |
| 2017 | $3,105 | $67,600 | $15,700 | $51,900 |
| 2016 | $3,077 | $67,600 | $15,700 | $51,900 |
| 2015 | $1,200 | $67,600 | $15,700 | $51,900 |
| 2014 | $2,258 | $67,600 | $15,700 | $51,900 |
Source: Public Records
Map
Nearby Homes
Your Personal Tour Guide
Ask me questions while you tour the home.