404 S 16th St Wilmington, NC 28401
The Bottom NeighborhoodEstimated Value: $269,000 - $292,000
3
Beds
1
Bath
1,080
Sq Ft
$258/Sq Ft
Est. Value
About This Home
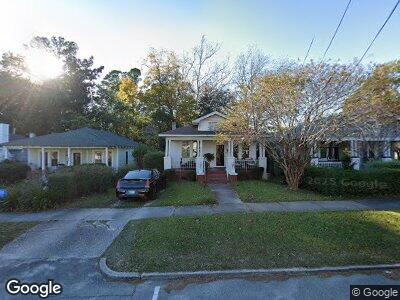
This home is located at 404 S 16th St, Wilmington, NC 28401 and is currently estimated at $278,630, approximately $257 per square foot. 404 S 16th St is a home located in New Hanover County with nearby schools including Snipes Academy of Arts & Design, Williston Middle School, and John T. Hoggard High School.
Ownership History
Date
Name
Owned For
Owner Type
Purchase Details
Closed on
Aug 30, 2007
Sold by
Peart Patricia Fleming
Bought by
Southerland James L
Current Estimated Value
Home Financials for this Owner
Home Financials are based on the most recent Mortgage that was taken out on this home.
Original Mortgage
$56,400
Interest Rate
6.27%
Mortgage Type
Unknown
Purchase Details
Closed on
Aug 23, 2007
Sold by
Southerland James L and Peart Patricia Fleming
Bought by
Southerland James L and Peart Patricia Fleming
Home Financials for this Owner
Home Financials are based on the most recent Mortgage that was taken out on this home.
Original Mortgage
$56,400
Interest Rate
6.27%
Mortgage Type
Unknown
Purchase Details
Closed on
Mar 9, 2001
Sold by
Ellis Edith Hrs
Bought by
Southerland James L
Purchase Details
Closed on
Oct 19, 1962
Sold by
Jones Mary L
Bought by
Ellis Edith S
Create a Home Valuation Report for This Property
The Home Valuation Report is an in-depth analysis detailing your home's value as well as a comparison with similar homes in the area
Home Values in the Area
Average Home Value in this Area
Purchase History
| Date | Buyer | Sale Price | Title Company |
|---|---|---|---|
| Southerland James L | -- | None Available | |
| Southerland James L | -- | None Available | |
| Southerland James L | -- | -- | |
| Ellis Edith Hrs | -- | -- | |
| Ellis Edith S | -- | -- |
Source: Public Records
Mortgage History
| Date | Status | Borrower | Loan Amount |
|---|---|---|---|
| Open | Southerland James L | $60,000 | |
| Closed | Southerland James L | $56,400 |
Source: Public Records
Tax History Compared to Growth
Tax History
| Year | Tax Paid | Tax Assessment Tax Assessment Total Assessment is a certain percentage of the fair market value that is determined by local assessors to be the total taxable value of land and additions on the property. | Land | Improvement |
|---|---|---|---|---|
| 2023 | $1,267 | $145,600 | $53,900 | $91,700 |
| 2022 | $1,238 | $145,600 | $53,900 | $91,700 |
| 2021 | $1,246 | $145,600 | $53,900 | $91,700 |
| 2020 | $1,161 | $110,200 | $31,400 | $78,800 |
| 2019 | $1,161 | $110,200 | $31,400 | $78,800 |
| 2018 | $1,161 | $110,200 | $31,400 | $78,800 |
| 2017 | $1,161 | $110,200 | $31,400 | $78,800 |
| 2016 | $901 | $81,300 | $27,200 | $54,100 |
| 2015 | $861 | $81,300 | $27,200 | $54,100 |
| 2014 | $824 | $81,300 | $27,200 | $54,100 |
Source: Public Records
Map
Nearby Homes