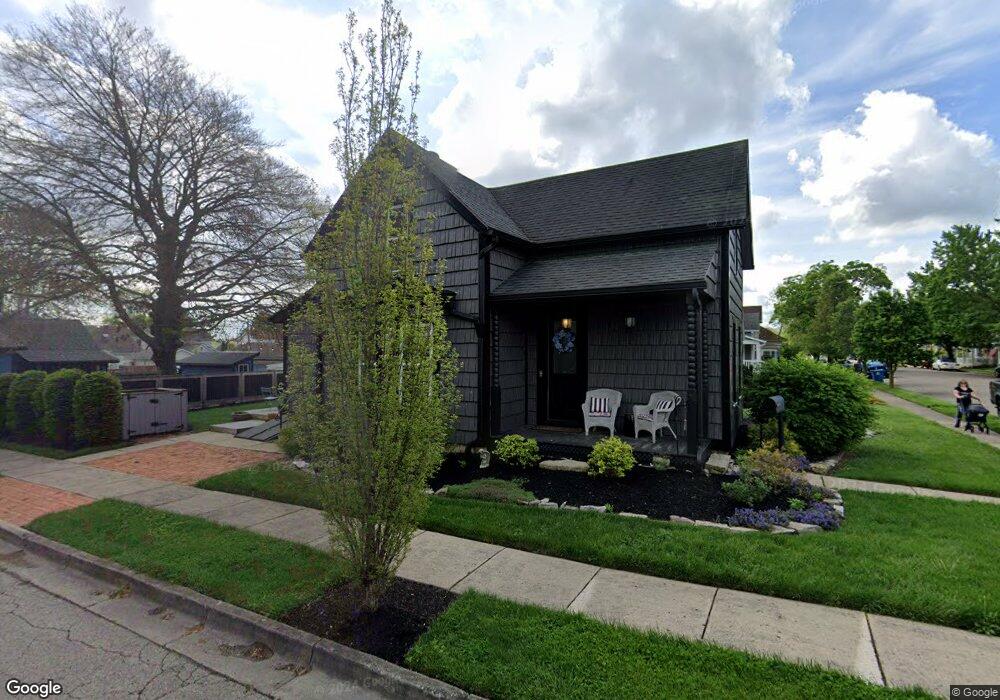
404 S 3rd St Tipp City, OH 45371
Estimated Value: $177,000 - $195,000
4
Beds
3
Baths
1,469
Sq Ft
$124/Sq Ft
Est. Value
About This Home
This home is located at 404 S 3rd St, Tipp City, OH 45371 and is currently estimated at $182,837, approximately $124 per square foot. 404 S 3rd St is a home located in Miami County with nearby schools including Broadway Elementary School, Nevin Coppock Elementary School, and L. T. Ball Intermediate School.
Ownership History
Date
Name
Owned For
Owner Type
Purchase Details
Closed on
Feb 7, 2018
Sold by
Nrz Reo V2 Corp
Bought by
Team Scenna Rentals Llc
Current Estimated Value
Purchase Details
Closed on
Feb 6, 2018
Sold by
Us Bank Na
Bought by
Nrz Reo V 2 Corp
Purchase Details
Closed on
Jul 18, 2017
Sold by
Miami County Sheriff
Bought by
Us Bank Na
Purchase Details
Closed on
Sep 12, 2000
Sold by
Oaks Barbara A and Estate Of Russell W Lehman
Bought by
Houk Eric A
Purchase Details
Closed on
Sep 1, 1988
Bought by
Lehman Russell W
Create a Home Valuation Report for This Property
The Home Valuation Report is an in-depth analysis detailing your home's value as well as a comparison with similar homes in the area
Home Values in the Area
Average Home Value in this Area
Purchase History
| Date | Buyer | Sale Price | Title Company |
|---|---|---|---|
| Team Scenna Rentals Llc | $105,600 | None Available | |
| Nrz Reo V 2 Corp | $500 | None Available | |
| Us Bank Na | $75,000 | -- | |
| Houk Eric A | $80,100 | -- | |
| Lehman Russell W | $38,000 | -- |
Source: Public Records
Mortgage History
| Date | Status | Borrower | Loan Amount |
|---|---|---|---|
| Closed | Houk Eric A | -- |
Source: Public Records
Tax History Compared to Growth
Tax History
| Year | Tax Paid | Tax Assessment Tax Assessment Total Assessment is a certain percentage of the fair market value that is determined by local assessors to be the total taxable value of land and additions on the property. | Land | Improvement |
|---|---|---|---|---|
| 2024 | $1,514 | $29,790 | $10,780 | $19,010 |
| 2023 | $1,514 | $29,790 | $10,780 | $19,010 |
| 2022 | $1,385 | $29,790 | $10,780 | $19,010 |
| 2021 | $1,175 | $22,930 | $8,300 | $14,630 |
| 2020 | $1,189 | $22,930 | $8,300 | $14,630 |
| 2019 | $1,200 | $22,930 | $8,300 | $14,630 |
| 2018 | $1,256 | $22,930 | $8,120 | $14,810 |
| 2017 | $1,353 | $22,930 | $8,120 | $14,810 |
| 2016 | $1,658 | $22,930 | $8,120 | $14,810 |
| 2015 | $1,390 | $27,620 | $9,770 | $17,850 |
| 2014 | $1,390 | $27,620 | $9,770 | $17,850 |
| 2013 | $1,397 | $27,620 | $9,770 | $17,850 |
Source: Public Records
Map
Nearby Homes