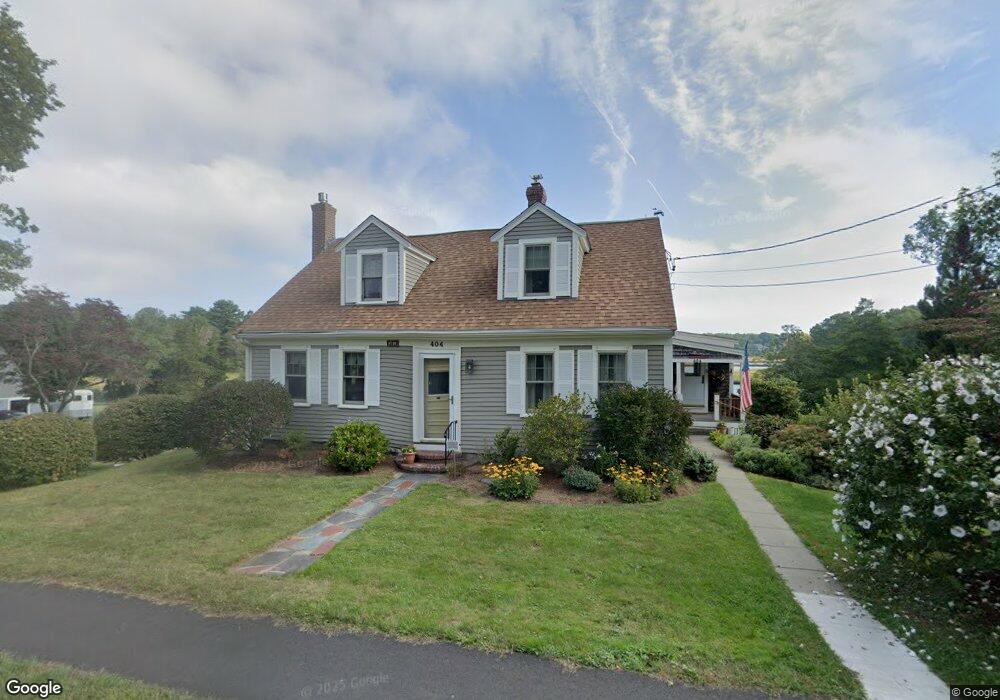
404 S Main St Cohasset, MA 02025
Estimated Value: $1,239,807 - $1,446,000
4
Beds
3
Baths
2,727
Sq Ft
$489/Sq Ft
Est. Value
About This Home
This home is located at 404 S Main St, Cohasset, MA 02025 and is currently estimated at $1,333,202, approximately $488 per square foot. 404 S Main St is a home located in Norfolk County with nearby schools including Joseph Osgood School, Deer Hill School, and Cohasset Middle School.
Ownership History
Date
Name
Owned For
Owner Type
Purchase Details
Closed on
Jul 26, 1999
Sold by
Sisson Ruth C
Bought by
Collins Francis D and Collins Gail J
Current Estimated Value
Home Financials for this Owner
Home Financials are based on the most recent Mortgage that was taken out on this home.
Original Mortgage
$30,000
Interest Rate
7.49%
Mortgage Type
Purchase Money Mortgage
Create a Home Valuation Report for This Property
The Home Valuation Report is an in-depth analysis detailing your home's value as well as a comparison with similar homes in the area
Home Values in the Area
Average Home Value in this Area
Purchase History
| Date | Buyer | Sale Price | Title Company |
|---|---|---|---|
| Collins Francis D | $60,000 | -- |
Source: Public Records
Mortgage History
| Date | Status | Borrower | Loan Amount |
|---|---|---|---|
| Open | Collins Francis D | $146,000 | |
| Closed | Collins Francis D | $30,000 | |
| Previous Owner | Collins Francis D | $157,500 | |
| Previous Owner | Collins Francis D | $60,000 |
Source: Public Records
Tax History Compared to Growth
Tax History
| Year | Tax Paid | Tax Assessment Tax Assessment Total Assessment is a certain percentage of the fair market value that is determined by local assessors to be the total taxable value of land and additions on the property. | Land | Improvement |
|---|---|---|---|---|
| 2025 | $11,625 | $1,003,900 | $675,400 | $328,500 |
| 2024 | $10,588 | $870,000 | $540,000 | $330,000 |
| 2023 | $9,893 | $838,400 | $519,300 | $319,100 |
| 2022 | $8,977 | $714,700 | $420,500 | $294,200 |
| 2021 | $8,683 | $665,900 | $420,500 | $245,400 |
| 2020 | $8,637 | $665,900 | $420,500 | $245,400 |
| 2019 | $8,590 | $665,900 | $420,500 | $245,400 |
| 2018 | $8,517 | $665,900 | $420,500 | $245,400 |
| 2017 | $8,477 | $649,100 | $420,500 | $228,600 |
| 2016 | $8,360 | $649,100 | $420,500 | $228,600 |
| 2015 | $7,944 | $625,000 | $396,400 | $228,600 |
| 2014 | $7,838 | $625,000 | $396,400 | $228,600 |
Source: Public Records
Map
Nearby Homes
- 405 S Main St
- 412 S Main St
- 411 S Main St
- 418 S Main St
- 393 S Main St
- 417 S Main St
- 391 S Main St
- 390 S Main St
- 383 S Main St
- 382 S Main St
- 430 S Main St Unit 5
- 430 S Main St Unit 4
- 430 S Main St Unit 3
- 430 S Main St Unit 2
- 430 S Main St Unit 1
- 430 S Main St
- 427 S Main St
- 377 S Main St
- 419 S Main St
- 429 S Main St