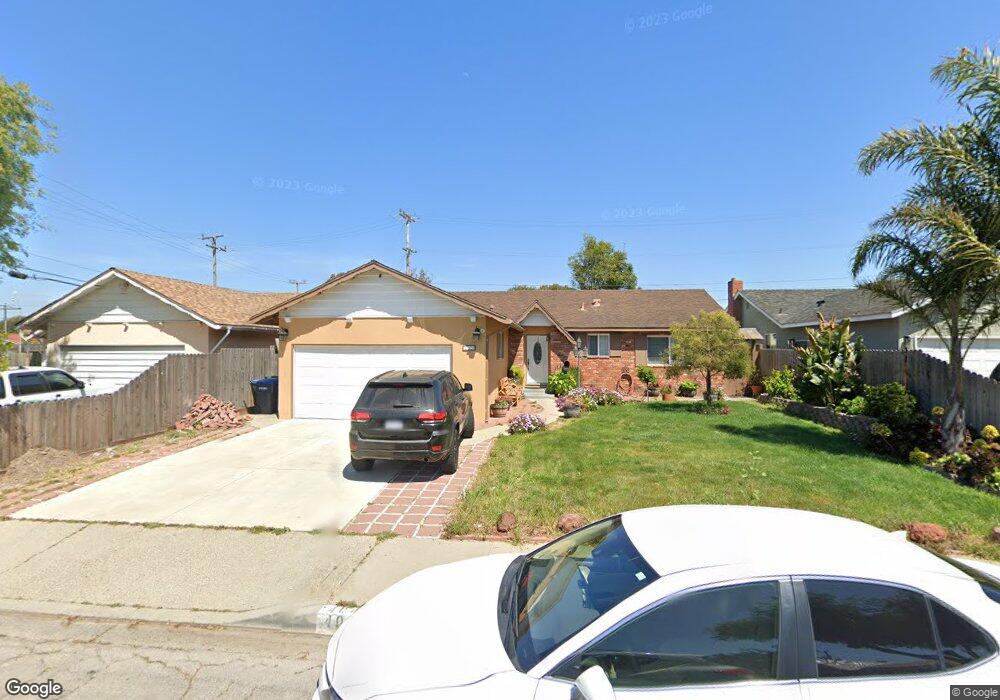
404 S O Place Lompoc, CA 93436
Estimated Value: $272,534 - $581,000
4
Beds
2
Baths
1,392
Sq Ft
$330/Sq Ft
Est. Value
About This Home
This home is located at 404 S O Place, Lompoc, CA 93436 and is currently estimated at $459,634, approximately $330 per square foot. 404 S O Place is a home located in Santa Barbara County with nearby schools including Miguelito Elementary School, Lompoc Valley Middle School, and Lompoc High School.
Ownership History
Date
Name
Owned For
Owner Type
Purchase Details
Closed on
Dec 3, 2024
Sold by
Bueno Cesar
Bought by
Bueno Cesar and Bueno Carlos
Current Estimated Value
Home Financials for this Owner
Home Financials are based on the most recent Mortgage that was taken out on this home.
Original Mortgage
$70,000
Interest Rate
6.76%
Mortgage Type
New Conventional
Purchase Details
Closed on
Feb 4, 2016
Sold by
Bueno Carina
Bought by
Bueno Cesar
Home Financials for this Owner
Home Financials are based on the most recent Mortgage that was taken out on this home.
Original Mortgage
$228,000
Interest Rate
3.98%
Mortgage Type
New Conventional
Purchase Details
Closed on
Apr 30, 2010
Sold by
Castro Javier
Bought by
Bueno Cesar and Bueno Carina
Home Financials for this Owner
Home Financials are based on the most recent Mortgage that was taken out on this home.
Original Mortgage
$229,904
Interest Rate
5.5%
Mortgage Type
FHA
Purchase Details
Closed on
Dec 29, 2009
Sold by
Solis Castro Nancy
Bought by
Castor Javier
Purchase Details
Closed on
Dec 28, 2009
Sold by
Deutsche Bank National Trust Company
Bought by
Castro Javier
Purchase Details
Closed on
Aug 27, 2009
Sold by
Ramirez Henry J and Ramirez Rachel I
Bought by
Deutsche Bank National Trust Company
Purchase Details
Closed on
Apr 20, 2001
Sold by
Ramirez Henry J and Ramirez Rachel I
Bought by
Ramirez Henry J and Ramirez Rachel I
Home Financials for this Owner
Home Financials are based on the most recent Mortgage that was taken out on this home.
Original Mortgage
$28,000
Interest Rate
6.57%
Mortgage Type
Stand Alone Second
Purchase Details
Closed on
May 17, 1999
Sold by
Dydell Richard H and Dydell Nela M
Bought by
Ramirez Henry J and Broadhead Rachel I
Home Financials for this Owner
Home Financials are based on the most recent Mortgage that was taken out on this home.
Original Mortgage
$127,914
Interest Rate
7.05%
Mortgage Type
FHA
Create a Home Valuation Report for This Property
The Home Valuation Report is an in-depth analysis detailing your home's value as well as a comparison with similar homes in the area
Home Values in the Area
Average Home Value in this Area
Purchase History
| Date | Buyer | Sale Price | Title Company |
|---|---|---|---|
| Bueno Cesar | $272,500 | None Listed On Document | |
| Bueno Cesar | -- | Fidelity National Title Co | |
| Bueno Cesar | $251,500 | First American Title Company | |
| Castor Javier | -- | Lsi Title Agency Inc | |
| Castro Javier | $145,000 | Lsi Title Agency Inc | |
| Deutsche Bank National Trust Company | $324,207 | Accommodation | |
| Ramirez Henry J | -- | First American Title | |
| Ramirez Henry J | $129,000 | Chicago Title Co |
Source: Public Records
Mortgage History
| Date | Status | Borrower | Loan Amount |
|---|---|---|---|
| Previous Owner | Bueno Cesar | $70,000 | |
| Previous Owner | Bueno Cesar | $228,000 | |
| Previous Owner | Bueno Cesar | $229,904 | |
| Previous Owner | Ramirez Henry J | $28,000 | |
| Previous Owner | Ramirez Henry J | $127,914 |
Source: Public Records
Tax History
| Year | Tax Paid | Tax Assessment Tax Assessment Total Assessment is a certain percentage of the fair market value that is determined by local assessors to be the total taxable value of land and additions on the property. | Land | Improvement |
|---|---|---|---|---|
| 2025 | $3,619 | $330,999 | $108,391 | $222,608 |
| 2023 | $3,619 | $318,148 | $104,183 | $213,965 |
| 2022 | $3,557 | $311,911 | $102,141 | $209,770 |
| 2021 | $3,596 | $305,796 | $100,139 | $205,657 |
| 2020 | $3,558 | $302,662 | $99,113 | $203,549 |
| 2019 | $3,499 | $296,728 | $97,170 | $199,558 |
| 2018 | $3,445 | $290,911 | $95,265 | $195,646 |
| 2017 | $3,383 | $285,208 | $93,398 | $191,810 |
| 2016 | $3,259 | $274,233 | $98,134 | $176,099 |
| 2015 | $3,235 | $270,114 | $96,660 | $173,454 |
| 2014 | $3,190 | $264,824 | $94,767 | $170,057 |
Source: Public Records
Map
Nearby Homes
- 413 S O Place
- 425 S J St
- 1328 W Willow Ave
- 23 Village Circle Dr
- 215 S H St
- 217 N M St
- 117 S I St
- 1011 W Walnut Ave
- 1410 W Apricot Ave
- 267 Village Circle Dr
- 1408 W Walnut Ave
- 112 N X St
- 616 University Dr
- 205 S E St
- 400 Coronado Dr
- 801, 851 California 246
- 524 Avalon St
- 1355 Crown Cir
- 531 N O St
- 526 N L St
Your Personal Tour Guide
Ask me questions while you tour the home.