Estimated Value: $214,942 - $232,000
3
Beds
2
Baths
1,788
Sq Ft
$125/Sq Ft
Est. Value
About This Home
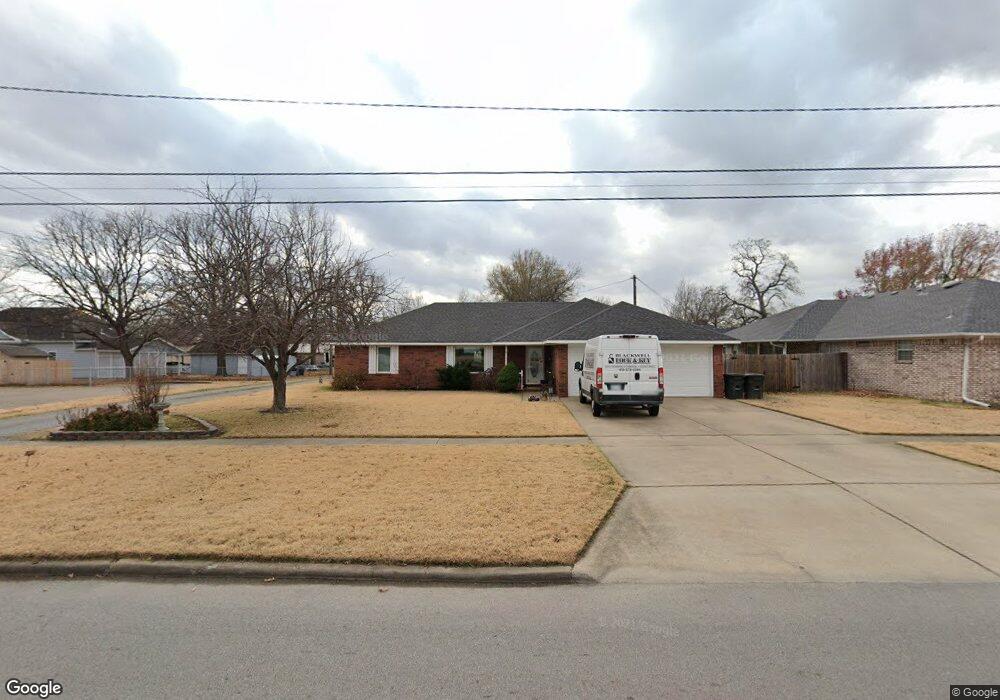
This home is located at 404 SE 1st St, Pryor, OK 74361 and is currently estimated at $224,236, approximately $125 per square foot. 404 SE 1st St is a home located in Mayes County with nearby schools including Pryor Middle School, Pryor High School, and William Bradford Christian School.
Ownership History
Date
Name
Owned For
Owner Type
Purchase Details
Closed on
Nov 20, 2009
Sold by
Neely David L and Neely Phyllis Ann
Bought by
Blackwell Marcena L and Blackwell Scott A
Current Estimated Value
Home Financials for this Owner
Home Financials are based on the most recent Mortgage that was taken out on this home.
Original Mortgage
$125,681
Outstanding Balance
$81,690
Interest Rate
4.99%
Mortgage Type
FHA
Estimated Equity
$142,546
Purchase Details
Closed on
Aug 26, 2005
Sold by
Hardy Rosemary
Bought by
Neely David L and Neely Phyllis Ann
Home Financials for this Owner
Home Financials are based on the most recent Mortgage that was taken out on this home.
Original Mortgage
$103,200
Interest Rate
5.61%
Mortgage Type
New Conventional
Purchase Details
Closed on
Aug 3, 1994
Sold by
Mozingo Robert A
Bought by
Hardy Vincil
Create a Home Valuation Report for This Property
The Home Valuation Report is an in-depth analysis detailing your home's value as well as a comparison with similar homes in the area
Home Values in the Area
Average Home Value in this Area
Purchase History
| Date | Buyer | Sale Price | Title Company |
|---|---|---|---|
| Blackwell Marcena L | $128,000 | None Available | |
| Neely David L | $129,000 | None Available | |
| Hardy Vincil | $99,500 | -- |
Source: Public Records
Mortgage History
| Date | Status | Borrower | Loan Amount |
|---|---|---|---|
| Open | Blackwell Marcena L | $125,681 | |
| Previous Owner | Neely David L | $103,200 |
Source: Public Records
Tax History Compared to Growth
Tax History
| Year | Tax Paid | Tax Assessment Tax Assessment Total Assessment is a certain percentage of the fair market value that is determined by local assessors to be the total taxable value of land and additions on the property. | Land | Improvement |
|---|---|---|---|---|
| 2025 | $1,699 | $21,113 | $2,057 | $19,056 |
| 2024 | $1,646 | $20,497 | $1,997 | $18,500 |
| 2023 | $1,646 | $19,900 | $2,120 | $17,780 |
| 2022 | $1,531 | $19,321 | $2,116 | $17,205 |
| 2021 | $1,499 | $18,758 | $2,109 | $16,649 |
| 2020 | $1,425 | $18,212 | $2,084 | $16,128 |
| 2019 | $1,424 | $17,682 | $1,947 | $15,735 |
| 2018 | $1,372 | $17,166 | $1,746 | $15,420 |
| 2017 | $1,336 | $17,922 | $1,746 | $16,176 |
| 2016 | $1,412 | $18,708 | $1,622 | $17,086 |
| 2015 | $1,400 | $18,276 | $1,622 | $16,654 |
| 2014 | $1,357 | $17,744 | $1,622 | $16,122 |
Source: Public Records
Map
Nearby Homes
- 107 S Coo Y Yah St
- 204 S Rowe St
- 20 S Elliott St
- 303 SE 3rd St
- 0 N 4318 Rd Unit 2522371
- 4748 N 4318 Rd
- 1545 S 4260 Rd
- 102 S Elliott St
- 902 SE 1st St
- 215 S Elliott St
- 902 SE 2nd St
- 7 S Orphan St
- 115 N Indianola St
- 201 N Coo Y Yah St
- 0 S Orphan St
- 201 N Indianola St
- 107 N Orphan St
- 304 N Hogan St
- 3 N Ora St
- 15 S Mayes St
- 101 S Rowe St
- 105 S Rowe St
- 414 SE 1st St
- 102 S Coo Y Yah St
- 107 S Rowe St
- 104 S Coo Y Yah St
- 109 S Rowe St
- 18 S Coo Y Yah St
- 100 S Rowe St
- 106 S Coo Y Yah St
- 102 S Rowe St
- 111 S Rowe St
- 111 S Rowe St
- 110 S Coo Y Yah St
- 525 SE 1st St
- 17 S Coo Y Yah St
- 17 S Coo-Y-yah
- 106 S Rowe St
- 16 S Coo Y Yah St
- 14 S Coo Y Yah St