Estimated Value: $178,874
Studio
2
Baths
2,400
Sq Ft
$75/Sq Ft
Est. Value
About This Home
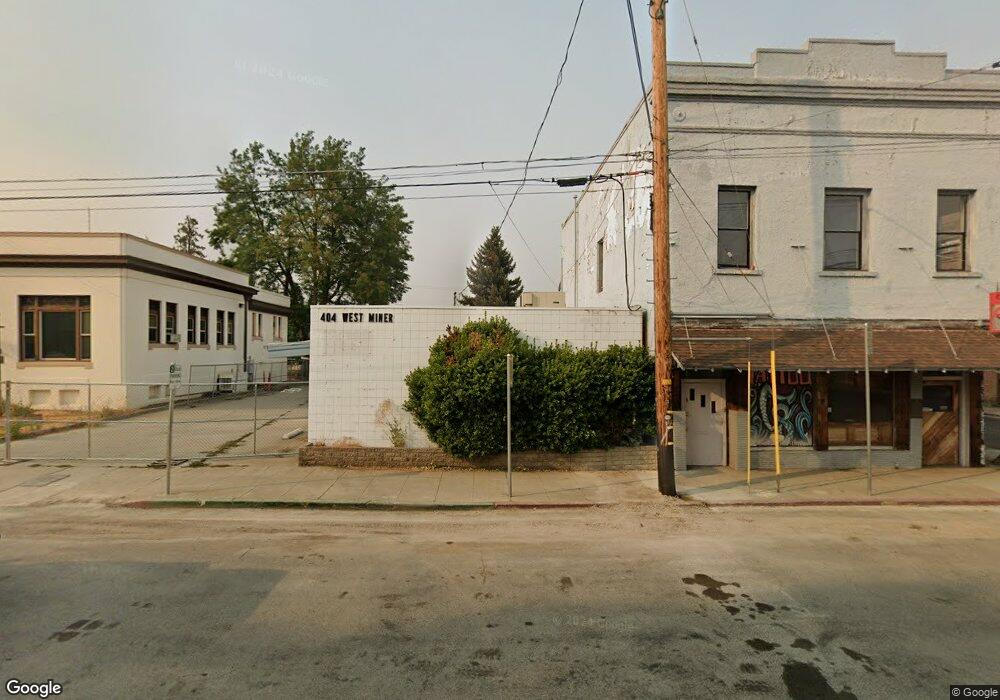
This home is located at 404 W Miner St, Yreka, CA 96097 and is currently estimated at $178,874, approximately $74 per square foot. 404 W Miner St is a home located in Siskiyou County with nearby schools including Evergreen Elementary School, Jackson Street Elementary School, and Yreka High School.
Ownership History
Date
Name
Owned For
Owner Type
Purchase Details
Closed on
May 13, 2024
Sold by
Hanks Michael D and Hanks Kara
Bought by
Siskiyou County Economic Development Council
Current Estimated Value
Purchase Details
Closed on
May 30, 2017
Sold by
Black Ronald L and Ronald L Black Trust
Bought by
Hanks Michael D and Hanks Kara
Home Financials for this Owner
Home Financials are based on the most recent Mortgage that was taken out on this home.
Original Mortgage
$49,000
Interest Rate
3.97%
Mortgage Type
Seller Take Back
Purchase Details
Closed on
Feb 16, 2008
Sold by
Black Delbert L and Delbert L Black 1986 Trust
Bought by
Black Ronald L and Ronald L Black Trust
Create a Home Valuation Report for This Property
The Home Valuation Report is an in-depth analysis detailing your home's value as well as a comparison with similar homes in the area
Home Values in the Area
Average Home Value in this Area
Purchase History
| Date | Buyer | Sale Price | Title Company |
|---|---|---|---|
| Siskiyou County Economic Development Council | $180,000 | Mt Shasta Title & Escrow | |
| Hanks Michael D | $84,000 | Mt Shasta Title & Escrow | |
| Black Ronald L | -- | None Available |
Source: Public Records
Mortgage History
| Date | Status | Borrower | Loan Amount |
|---|---|---|---|
| Previous Owner | Hanks Michael D | $49,000 |
Source: Public Records
Tax History
| Year | Tax Paid | Tax Assessment Tax Assessment Total Assessment is a certain percentage of the fair market value that is determined by local assessors to be the total taxable value of land and additions on the property. | Land | Improvement |
|---|---|---|---|---|
| 2025 | $999 | $183,600 | $51,000 | $132,600 |
| 2023 | $999 | $93,698 | $26,769 | $66,929 |
| 2022 | $961 | $91,862 | $26,245 | $65,617 |
| 2021 | $945 | $90,062 | $25,731 | $64,331 |
| 2020 | $939 | $89,140 | $25,468 | $63,672 |
| 2019 | $923 | $87,393 | $24,969 | $62,424 |
| 2018 | $905 | $85,680 | $24,480 | $61,200 |
| 2017 | $1,310 | $124,000 | $44,000 | $80,000 |
| 2016 | $1,306 | $124,000 | $44,000 | $80,000 |
| 2015 | $1,306 | $124,000 | $44,000 | $80,000 |
| 2014 | $1,284 | $124,000 | $44,000 | $80,000 |
Source: Public Records
Map
Nearby Homes
- 400 W Miner St
- 117 N Oregon St
- 109 N Oregon St
- 399 W Miner St
- 402 W Miner St
- 407 North St
- 328 W Miner St
- 326 W Miner St
- 118 N Oregon St
- 333 W Miner St
- 331 W Miner St
- 427 North St
- 322 W Miner St
- 0 10 Acres Riverview Dr
- 122 N Oregon St
- 325 W Miner St
- 111 S Oregon St
- 320 W Miner St
- 400 North St
- 321 W Miner St
Your Personal Tour Guide
Ask me questions while you tour the home.