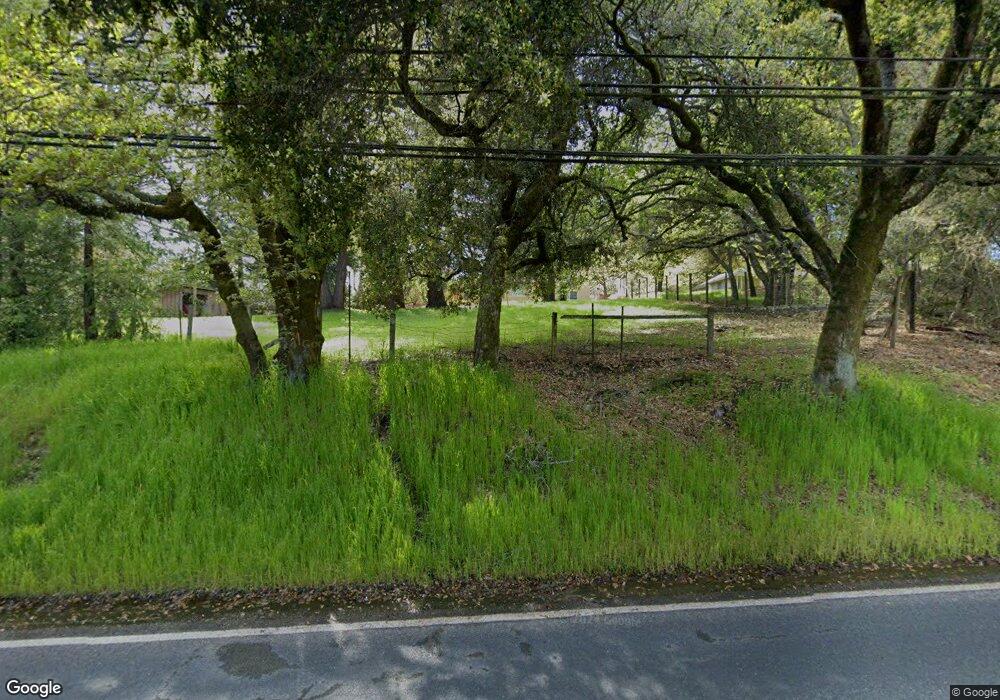
404 Watertrough Rd Sebastopol, CA 95472
Estimated Value: $1,041,000 - $1,798,000
3
Beds
3
Baths
1,975
Sq Ft
$744/Sq Ft
Est. Value
About This Home
This home is located at 404 Watertrough Rd, Sebastopol, CA 95472 and is currently estimated at $1,469,144, approximately $743 per square foot. 404 Watertrough Rd is a home located in Sonoma County with nearby schools including Apple Blossom School, Analy High School, and Sunridge Charter School.
Ownership History
Date
Name
Owned For
Owner Type
Purchase Details
Closed on
Dec 10, 2020
Sold by
Calvi Gary A and Calvi Lisa K
Bought by
Calvi Gary A and Calvi Lisa K
Current Estimated Value
Home Financials for this Owner
Home Financials are based on the most recent Mortgage that was taken out on this home.
Original Mortgage
$471,000
Outstanding Balance
$420,078
Interest Rate
2.8%
Mortgage Type
New Conventional
Estimated Equity
$1,049,066
Purchase Details
Closed on
Feb 19, 2015
Sold by
Calvi Gary A and Calvi Lisa K
Bought by
The Gary A Calvi & Lisa K Calvi 2001 Tru
Purchase Details
Closed on
Jul 13, 2004
Sold by
Shore Madeleine A
Bought by
Calvi Gary A and Calvi Lisa K
Home Financials for this Owner
Home Financials are based on the most recent Mortgage that was taken out on this home.
Original Mortgage
$484,000
Interest Rate
5.37%
Mortgage Type
Unknown
Create a Home Valuation Report for This Property
The Home Valuation Report is an in-depth analysis detailing your home's value as well as a comparison with similar homes in the area
Purchase History
We collect this data history from publicly available records. To have your information removed, we recommend requesting removal directly through your county’s website.
| Date | Buyer | Sale Price | Title Company |
|---|---|---|---|
| Calvi Gary A | -- | Fidelity National Title Co | |
| The Gary A Calvi & Lisa K Calvi 2001 Tru | -- | None Available | |
| Calvi Gary A | $766,000 | Old Republic Title Company |
Source: Public Records
Mortgage History
We collect this data history from publicly available records. To have your information removed, we recommend requesting removal directly through your county’s website.
| Date | Status | Borrower | Loan Amount |
|---|---|---|---|
| Open | Calvi Gary A | $471,000 | |
| Closed | Calvi Gary A | $484,000 | |
| Closed | Calvi Gary A | $140,000 |
Source: Public Records
Tax History
| Year | Tax Paid | Tax Assessment Tax Assessment Total Assessment is a certain percentage of the fair market value that is determined by local assessors to be the total taxable value of land and additions on the property. | Land | Improvement |
|---|---|---|---|---|
| 2025 | $12,219 | $1,067,721 | $487,861 | $579,860 |
| 2024 | $12,228 | $1,046,787 | $478,296 | $568,491 |
| 2023 | $12,228 | $1,026,263 | $468,918 | $557,345 |
| 2022 | $11,612 | $1,006,141 | $459,724 | $546,417 |
| 2021 | $11,383 | $986,413 | $450,710 | $535,703 |
| 2020 | $11,470 | $976,300 | $446,089 | $530,211 |
| 2019 | $11,052 | $957,158 | $437,343 | $519,815 |
| 2018 | $10,871 | $938,391 | $428,768 | $509,623 |
| 2017 | $10,388 | $919,992 | $420,361 | $499,631 |
| 2016 | $10,223 | $901,954 | $412,119 | $489,835 |
| 2015 | $8,928 | $807,000 | $369,000 | $438,000 |
| 2014 | $7,718 | $696,000 | $318,000 | $378,000 |
Source: Public Records
Map
Nearby Homes
- 755 Watertrough Rd
- 0 Bodega Hwy
- 171 Gold Ridge Rd
- 8086 Bodega Ave
- 455 Sequoia Ln
- 7925 Juanita Ct
- 1426 Darby Rd
- 539 Norlee St
- 940 Ferguson Rd
- 7804 Anthony St
- 505 Norlee St
- 604 Live Oak Ave
- 7580 Washington Ave
- 614 Live Oak Ave
- 9275 Ferguson Ct
- 285 Neva St
- 8099 Yule Tree Ln
- 431 Sexton Rd
- 7420 Woodland Ave
- 375 Florence Ave
- 340 Watertrough Rd
- 320 Watertrough Rd
- 401 Watertrough Rd
- 292 Watertrough Rd
- 408 Watertrough Rd
- 415 Watertrough Rd
- 385 Watertrough Rd
- 421 Watertrough Rd
- 291 Watertrough Rd
- 498 Watertrough Rd
- 222 Schuh Ln
- 301 Watertrough Rd
- 265 Watertrough Rd
- 8919 Bodega Hwy
- 240 Watertrough Rd
- 503 Watertrough Rd
- 8921 Avila Ln
- 8909 Bodega Hwy
- 8707 Starlight Ln
- 8917 Bodega Hwy
Your Personal Tour Guide
Ask me questions while you tour the home.