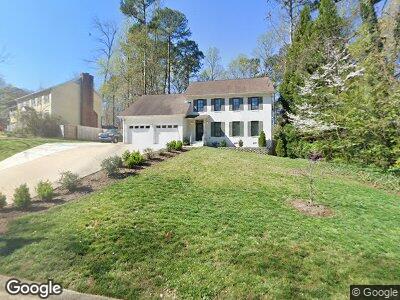
404 Whitehall Way Unit 1012 Cary, NC 27511
Cary Towne Center NeighborhoodEstimated Value: $617,000 - $655,117
--
Bed
3
Baths
2,464
Sq Ft
$260/Sq Ft
Est. Value
About This Home
This home is located at 404 Whitehall Way Unit 1012, Cary, NC 27511 and is currently estimated at $641,279, approximately $260 per square foot. 404 Whitehall Way Unit 1012 is a home located in Wake County with nearby schools including Adams Elementary, East Cary Middle School, and Cary High School.
Ownership History
Date
Name
Owned For
Owner Type
Purchase Details
Closed on
Feb 15, 2023
Sold by
Muller & Balboa Group Llc
Bought by
Muller & Balboa Group Llc
Current Estimated Value
Home Financials for this Owner
Home Financials are based on the most recent Mortgage that was taken out on this home.
Original Mortgage
$531,000
Outstanding Balance
$523,272
Interest Rate
7.63%
Mortgage Type
New Conventional
Purchase Details
Closed on
Oct 17, 2022
Sold by
Anderson Jonathan W
Bought by
Muller & Balboa Group Llc
Home Financials for this Owner
Home Financials are based on the most recent Mortgage that was taken out on this home.
Original Mortgage
$402,445
Interest Rate
5.89%
Mortgage Type
New Conventional
Purchase Details
Closed on
Nov 2, 1983
Bought by
Holland Ronald S
Create a Home Valuation Report for This Property
The Home Valuation Report is an in-depth analysis detailing your home's value as well as a comparison with similar homes in the area
Home Values in the Area
Average Home Value in this Area
Purchase History
| Date | Buyer | Sale Price | Title Company |
|---|---|---|---|
| Muller & Balboa Group Llc | $590,000 | -- | |
| Muller & Balboa Group Llc | $400,000 | -- | |
| Holland Ronald S | $22,500 | -- |
Source: Public Records
Mortgage History
| Date | Status | Borrower | Loan Amount |
|---|---|---|---|
| Open | Muller & Balboa Group Llc | $531,000 | |
| Previous Owner | Muller & Balboa Group Llc | $402,445 | |
| Previous Owner | Holland Ronald S | $85,989 | |
| Previous Owner | Holland Ronald S | $82,000 | |
| Previous Owner | Holland Ronald S | $85,986 | |
| Previous Owner | Holland Ronald S | $92,000 | |
| Previous Owner | Holland Ronald S | $76,616 |
Source: Public Records
Tax History Compared to Growth
Tax History
| Year | Tax Paid | Tax Assessment Tax Assessment Total Assessment is a certain percentage of the fair market value that is determined by local assessors to be the total taxable value of land and additions on the property. | Land | Improvement |
|---|---|---|---|---|
| 2024 | $4,957 | $588,755 | $175,000 | $413,755 |
| 2023 | $3,888 | $385,996 | $125,000 | $260,996 |
| 2022 | $3,317 | $341,852 | $125,000 | $216,852 |
| 2021 | $3,251 | $341,852 | $125,000 | $216,852 |
| 2020 | $3,268 | $341,852 | $125,000 | $216,852 |
| 2019 | $3,204 | $297,379 | $123,000 | $174,379 |
| 2018 | $3,007 | $297,379 | $123,000 | $174,379 |
| 2017 | $2,890 | $297,379 | $123,000 | $174,379 |
| 2016 | $2,847 | $297,379 | $123,000 | $174,379 |
| 2015 | $2,393 | $241,060 | $74,000 | $167,060 |
| 2014 | $2,257 | $241,060 | $74,000 | $167,060 |
Source: Public Records
Map
Nearby Homes
- 1020 Nottingham Ct
- 1111 Nottingham Cir
- 1223 Jamestown Ct
- 1248 Jamestown Ct
- 125 Karen Ct Unit 125-127
- 1209 Shincliffe Ct
- 713 Godwin Ct
- 1201 Deerfield Dr
- 192 Glenpark Place
- 6011 Winterpointe Ln Unit 205
- 6001 Winterpointe Ln Unit 102
- 6001 Winterpointe Ln Unit 204
- 136 Glenpark Place
- 6120 Sunpointe Dr Unit 102
- 5923 Suncreek Ct
- 612 Harvest Ln
- 5805 Farm Gate Rd
- 1209 Kingston Ridge Rd
- 1219 Walnut St
- 1213 Walnut St
- 404 Whitehall Way
- 404 Whitehall Way Unit 1012
- 502 Whitehall Way
- 402 Whitehall Way
- 306 Whitehall Way
- 504 Whitehall Way
- 310 Whitehall Way
- 407 Whitehall Way
- 308 Whitehall Way
- 405 Whitehall Way
- 304 Whitehall Way
- 102 Penwood Dr
- 403 Whitehall Way
- 302 Whitehall Way
- 401 Whitehall Way
- 503 Whitehall Way
- 505 Whitehall Way
- 119 Penwood Dr
- 104 Penwood Dr
- 121 Penwood Dr