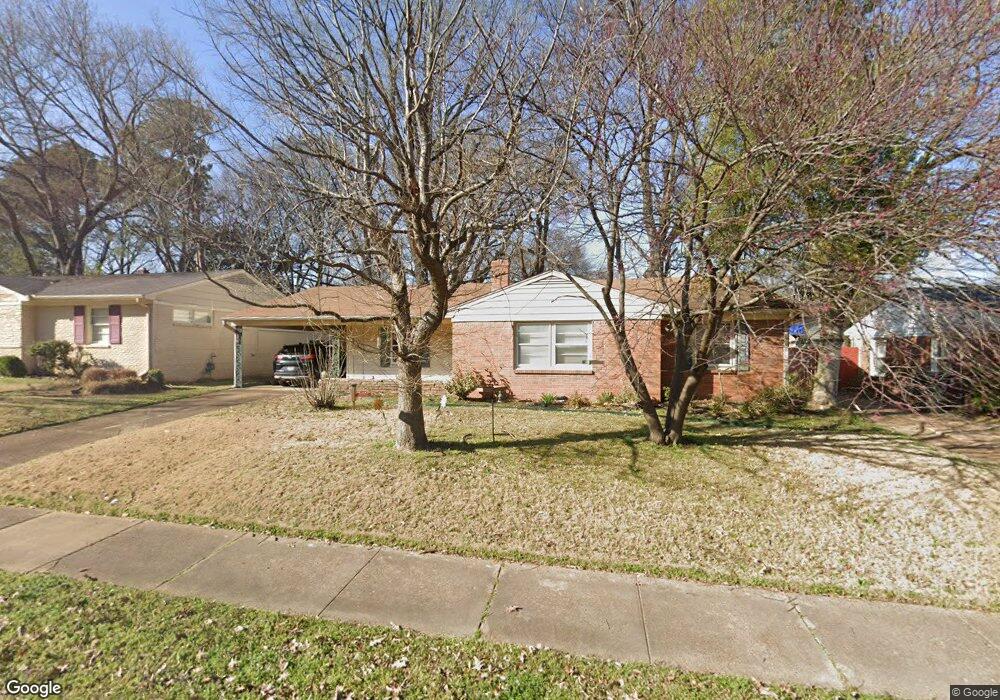
4040 Allison Ave Memphis, TN 38122
Audubon Park NeighborhoodEstimated Value: $240,000 - $280,000
4
Beds
2
Baths
1,756
Sq Ft
$151/Sq Ft
Est. Value
About This Home
This home is located at 4040 Allison Ave, Memphis, TN 38122 and is currently estimated at $264,384, approximately $150 per square foot. 4040 Allison Ave is a home located in Shelby County with nearby schools including Grahamwood Elementary School, White Station High, and White Station Middle.
Ownership History
Date
Name
Owned For
Owner Type
Purchase Details
Closed on
Mar 17, 2020
Sold by
Plitman Jonathan D and Hallie A Plitman Marker Trust
Bought by
Plitman Jonathan D and Adin S Marker Trust
Current Estimated Value
Purchase Details
Closed on
Sep 13, 2018
Sold by
Marker Hallie A Plitman and Litman Jonathan D
Bought by
Marker Hallie A Plitman and The Hallie A Plitman Marker Trust
Purchase Details
Closed on
Mar 20, 2012
Sold by
Plitman Rae
Bought by
Plitman Rae C and The Rae C Plitman Revocable Living Trust
Purchase Details
Closed on
Aug 2, 2004
Sold by
Sims Stephen S and Sims Kimberly R Meier
Bought by
Plitman Rae
Purchase Details
Closed on
Aug 27, 1997
Sold by
Milam Walter B and Milam Lynn W
Bought by
Sims Stephen S and Meier Sims Kimberly R
Home Financials for this Owner
Home Financials are based on the most recent Mortgage that was taken out on this home.
Original Mortgage
$90,250
Interest Rate
7.52%
Mortgage Type
Purchase Money Mortgage
Create a Home Valuation Report for This Property
The Home Valuation Report is an in-depth analysis detailing your home's value as well as a comparison with similar homes in the area
Home Values in the Area
Average Home Value in this Area
Purchase History
| Date | Buyer | Sale Price | Title Company |
|---|---|---|---|
| Plitman Jonathan D | -- | None Available | |
| Marker Hallie A Plitman | -- | None Available | |
| Plitman Rae C | -- | None Available | |
| Plitman Rae | $127,000 | -- | |
| Sims Stephen S | $95,000 | -- |
Source: Public Records
Mortgage History
| Date | Status | Borrower | Loan Amount |
|---|---|---|---|
| Previous Owner | Sims Stephen S | $90,250 |
Source: Public Records
Tax History Compared to Growth
Tax History
| Year | Tax Paid | Tax Assessment Tax Assessment Total Assessment is a certain percentage of the fair market value that is determined by local assessors to be the total taxable value of land and additions on the property. | Land | Improvement |
|---|---|---|---|---|
| 2025 | $1,877 | $59,725 | $12,075 | $47,650 |
| 2024 | $1,877 | $55,375 | $8,050 | $47,325 |
| 2023 | $3,373 | $55,375 | $8,050 | $47,325 |
| 2022 | $3,373 | $55,375 | $8,050 | $47,325 |
| 2021 | $4,009 | $55,375 | $8,050 | $47,325 |
| 2020 | $2,511 | $34,650 | $8,050 | $26,600 |
| 2019 | $1,107 | $34,650 | $8,050 | $26,600 |
| 2018 | $1,107 | $34,650 | $8,050 | $26,600 |
| 2017 | $1,134 | $34,650 | $8,050 | $26,600 |
| 2016 | $1,499 | $34,300 | $0 | $0 |
| 2014 | $1,499 | $34,300 | $0 | $0 |
Source: Public Records
Map
Nearby Homes
- 456 Sharon Dr
- 4047 Allison Ave
- 4079 Philwood Ave
- 4023 Hilldale Ave
- 504 Philwood Cove
- 4120 Hilldale Ave
- 4054 Saint Ann Cir
- 4143 Hilldale Ave
- 458 Gerald Rd
- 473 Vaughn Rd
- 4152 Barfield Rd
- 428 E Swan Ridge Cir
- 273 Saint Andrews Fairway
- 4151 Barfield Rd
- 4237 Hilldale Ave
- 250 Saint Andrews Fairway
- 0 Western Park Dr
- 219 N Rose Rd
- 3780 Shirlwood Ave Unit 31
- 4121 Faxon Ave
- 4030 Allison Ave
- 445 Sharon Dr
- 455 Sharon Dr
- 4024 Allison Ave
- 465 Sharon Dr
- 4041 Allison Ave
- 4035 Allison Ave
- 4043 Allison Ave
- 473 Sharon Dr
- 4029 Allison Ave
- 4048 Allison Ave
- 4045 Allison Ave
- 4021 Allison Ave
- 450 N Graham St
- 479 Sharon Dr
- 464 Sharon Dr
- 4007 Allison Ave
- 4052 Allison Ave
- 478 N Graham St
- 430 N Graham St