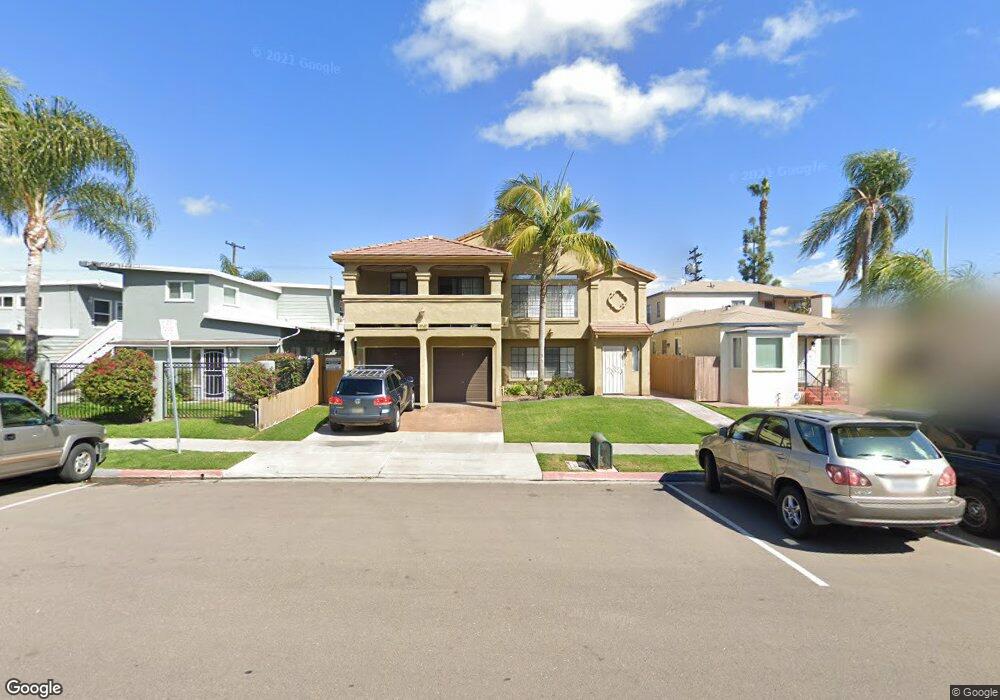
4041 Kansas St Unit 3 San Diego, CA 92104
North Park NeighborhoodEstimated Value: $610,929 - $695,000
2
Beds
3
Baths
840
Sq Ft
$770/Sq Ft
Est. Value
About This Home
This home is located at 4041 Kansas St Unit 3, San Diego, CA 92104 and is currently estimated at $646,482, approximately $769 per square foot. 4041 Kansas St Unit 3 is a home located in San Diego County with nearby schools including Garfield Elementary, Roosevelt International Middle School, and North Park Christian School.
Ownership History
Date
Name
Owned For
Owner Type
Purchase Details
Closed on
May 26, 2021
Sold by
Prodanovich Todd
Bought by
Prodanovich Todd Robin and The Todd Robin Prodanovich Liv
Current Estimated Value
Purchase Details
Closed on
Apr 21, 2017
Sold by
Nadel Sam Norman
Bought by
Prodanovich Todd
Home Financials for this Owner
Home Financials are based on the most recent Mortgage that was taken out on this home.
Original Mortgage
$285,000
Outstanding Balance
$237,293
Interest Rate
4.23%
Mortgage Type
New Conventional
Estimated Equity
$409,189
Purchase Details
Closed on
Sep 12, 2011
Sold by
Campbell Karen J and Campbell Marcia M
Bought by
Nadel Sam Norman
Home Financials for this Owner
Home Financials are based on the most recent Mortgage that was taken out on this home.
Original Mortgage
$137,600
Interest Rate
4.15%
Mortgage Type
New Conventional
Purchase Details
Closed on
Apr 20, 2003
Sold by
Campbell Karen J
Bought by
Campbell Karen J and Campbell Marcia M
Purchase Details
Closed on
Apr 30, 1993
Create a Home Valuation Report for This Property
The Home Valuation Report is an in-depth analysis detailing your home's value as well as a comparison with similar homes in the area
Home Values in the Area
Average Home Value in this Area
Purchase History
| Date | Buyer | Sale Price | Title Company |
|---|---|---|---|
| Prodanovich Todd Robin | -- | None Available | |
| Prodanovich Todd | $415,000 | Lawyers Title Company | |
| Nadel Sam Norman | $172,000 | Chicago Title Company | |
| Campbell Karen J | -- | -- | |
| -- | $114,800 | -- |
Source: Public Records
Mortgage History
| Date | Status | Borrower | Loan Amount |
|---|---|---|---|
| Open | Prodanovich Todd | $285,000 | |
| Previous Owner | Nadel Sam Norman | $137,600 |
Source: Public Records
Tax History Compared to Growth
Tax History
| Year | Tax Paid | Tax Assessment Tax Assessment Total Assessment is a certain percentage of the fair market value that is determined by local assessors to be the total taxable value of land and additions on the property. | Land | Improvement |
|---|---|---|---|---|
| 2025 | $5,767 | $481,637 | $184,674 | $296,963 |
| 2024 | $5,767 | $472,194 | $181,053 | $291,141 |
| 2023 | $5,638 | $462,936 | $177,503 | $285,433 |
| 2022 | $5,486 | $453,860 | $174,023 | $279,837 |
| 2021 | $5,446 | $444,961 | $170,611 | $274,350 |
| 2020 | $5,379 | $440,399 | $168,862 | $271,537 |
| 2019 | $5,281 | $431,764 | $165,551 | $266,213 |
| 2018 | $5,020 | $423,299 | $162,305 | $260,994 |
| 2017 | $2,142 | $186,147 | $71,374 | $114,773 |
| 2016 | $2,105 | $182,498 | $69,975 | $112,523 |
| 2015 | $2,073 | $179,757 | $68,924 | $110,833 |
| 2014 | $2,040 | $176,236 | $67,574 | $108,662 |
Source: Public Records
Map
Nearby Homes
- 4074 30th St
- 4043 Utah St Unit 8
- 4043 Utah St Unit 3
- 4119-23 Kansas
- 4030 Ohio St
- 3957 30th St Unit 319
- 3950 Ohio St Unit 507
- 4075 Idaho St Unit 2
- 4153-55 Utah St
- 2828 University Ave Unit 503
- 3939 Illinois St Unit 1C
- 4226 Utah St
- 4205 Ohio St Unit 204
- 4205 Ohio St Unit 106
- 3933-45 Hamilton St
- 4329 Idaho St Unit 104
- 4347 30th St Unit 53
- 4355 Utah St Unit 2
- 4366 Ohio St
- 3776 Villa Terrace
- 4041 Kansas St Unit 7
- 4041 Kansas St Unit 6
- 4041 Kansas St Unit 5
- 4041 Kansas St Unit 4
- 4041 Kansas St Unit 2
- 4041 Kansas St Unit 1
- 4033-37 Kansas St
- 4033 Kansas St
- 4059 Kansas St
- 4067 1/2 Kansas St
- 4027 Kansas St
- 4061 Kansas St Unit 67
- 4071 Kansas St
- 4013 Kansas St
- 4064 30th St
- 4015 Kansas St Unit 23
- 4075 Kansas St
- 4075/4077 Kansas St
- 4075 Kansas St
- 4062.5 30th St