
Seller's Agent in 2022
Daniel Brandenstein
Compass
(858) 610-6703
2 in this area
15 Total Sales
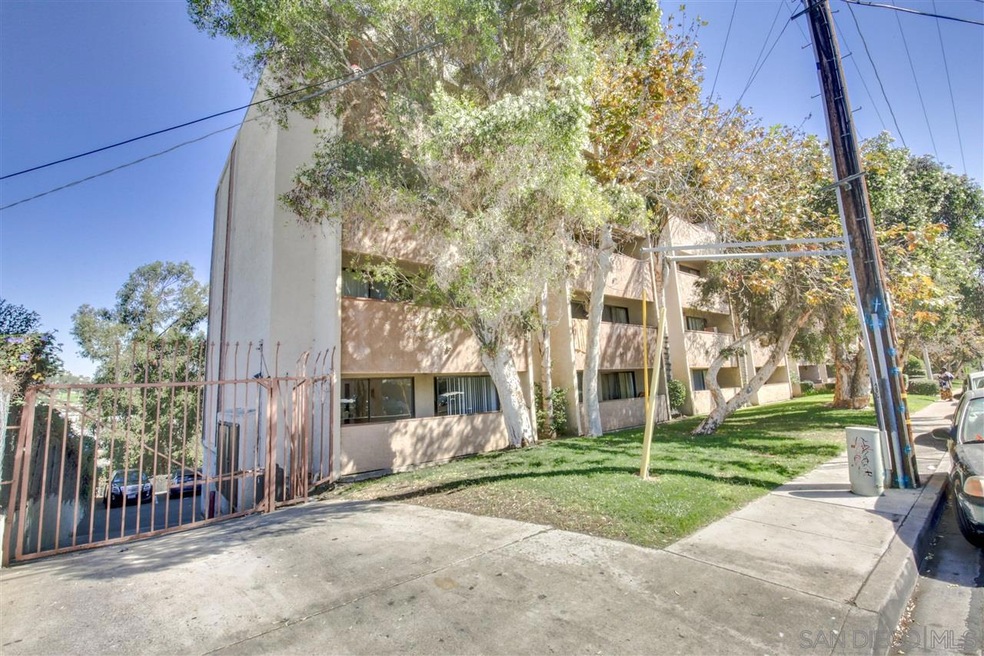
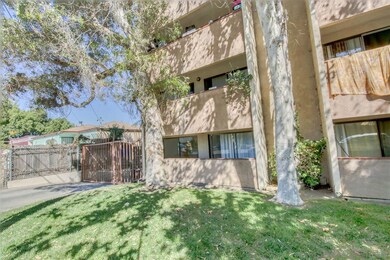
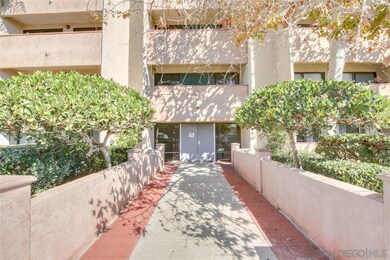
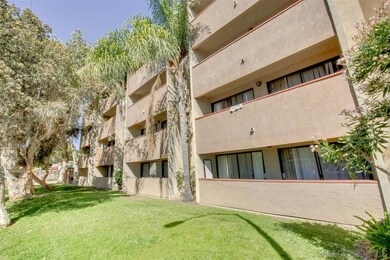
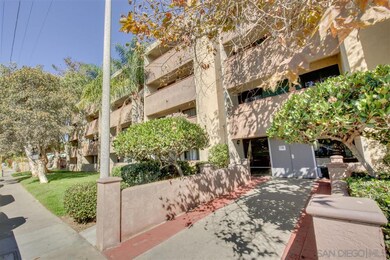
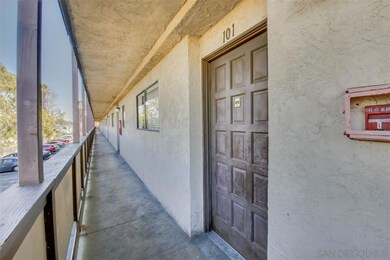

Great price! Looking for a buy and hold investor. Two bedrooms and two full bathrooms. Ground floor unit. All appliances convey. Stackable washer/dryer in the unit. Durable tile flooring. Two assigned parking spaces.
Last Agent to Sell the Property
Finest City Homes & Loans License #01869597 Listed on: 10/18/2017
Last Buyer's Agent
Carlos Arias
Dream Realty Inc License #01901110
| Date | Type | Sale Price | Title Company |
|---|---|---|---|
| Grant Deed | $400,000 | Fidelity National Title | |
| Grant Deed | $215,000 | Stewart Title Of California | |
| Grant Deed | $160,000 | Stewart Title Of California | |
| Grant Deed | $137,000 | Fidelity National Title | |
| Quit Claim Deed | -- | None Available | |
| Grant Deed | $101,000 | Ticor Title | |
| Interfamily Deed Transfer | -- | Accommodation | |
| Grant Deed | $100,000 | Old Republic Title Company | |
| Trustee Deed | $236,545 | Landsafe Title | |
| Condominium Deed | $216,000 | Fidelity National Title Co |
| Date | Status | Loan Amount | Loan Type |
|---|---|---|---|
| Previous Owner | $170,000 | New Conventional | |
| Previous Owner | $172,000 | New Conventional | |
| Previous Owner | $250,000 | Fannie Mae Freddie Mac | |
| Previous Owner | $172,800 | Purchase Money Mortgage | |
| Closed | $43,200 | No Value Available |
| Date | Event | Price | Change | Sq Ft Price |
|---|---|---|---|---|
| 08/15/2025 08/15/25 | For Rent | $2,400 | 0.0% | -- |
| 02/07/2022 02/07/22 | Sold | $400,000 | +11.4% | $444 / Sq Ft |
| 01/10/2022 01/10/22 | Pending | -- | -- | -- |
| 01/05/2022 01/05/22 | For Sale | $359,000 | +67.0% | $399 / Sq Ft |
| 06/21/2018 06/21/18 | Sold | $215,000 | -13.6% | $239 / Sq Ft |
| 05/26/2018 05/26/18 | Pending | -- | -- | -- |
| 05/06/2018 05/06/18 | Price Changed | $248,900 | -3.8% | $277 / Sq Ft |
| 04/27/2018 04/27/18 | Price Changed | $258,600 | 0.0% | $287 / Sq Ft |
| 04/20/2018 04/20/18 | Price Changed | $258,700 | 0.0% | $287 / Sq Ft |
| 04/13/2018 04/13/18 | Price Changed | $258,800 | 0.0% | $288 / Sq Ft |
| 03/23/2018 03/23/18 | Price Changed | $258,900 | 0.0% | $288 / Sq Ft |
| 03/23/2018 03/23/18 | For Sale | $258,900 | -5.8% | $288 / Sq Ft |
| 02/05/2018 02/05/18 | Pending | -- | -- | -- |
| 01/18/2018 01/18/18 | Price Changed | $274,900 | -3.5% | $305 / Sq Ft |
| 01/11/2018 01/11/18 | Price Changed | $284,900 | -1.4% | $317 / Sq Ft |
| 12/15/2017 12/15/17 | For Sale | $289,000 | +80.6% | $321 / Sq Ft |
| 11/06/2017 11/06/17 | Sold | $160,000 | 0.0% | $178 / Sq Ft |
| 10/28/2017 10/28/17 | Pending | -- | -- | -- |
| 10/27/2017 10/27/17 | For Sale | $160,000 | 0.0% | $178 / Sq Ft |
| 10/22/2017 10/22/17 | Pending | -- | -- | -- |
| 10/18/2017 10/18/17 | For Sale | $160,000 | +16.8% | $178 / Sq Ft |
| 02/01/2017 02/01/17 | Sold | $137,000 | -2.1% | $152 / Sq Ft |
| 01/23/2017 01/23/17 | Pending | -- | -- | -- |
| 01/11/2017 01/11/17 | Price Changed | $140,000 | -9.7% | $156 / Sq Ft |
| 12/20/2016 12/20/16 | For Sale | $155,000 | +2.0% | $172 / Sq Ft |
| 11/13/2015 11/13/15 | Sold | $152,000 | -4.4% | $169 / Sq Ft |
| 11/07/2015 11/07/15 | Pending | -- | -- | -- |
| 09/21/2015 09/21/15 | For Sale | $159,000 | 0.0% | $177 / Sq Ft |
| 08/20/2015 08/20/15 | Pending | -- | -- | -- |
| 07/24/2015 07/24/15 | For Sale | $159,000 | +57.4% | $177 / Sq Ft |
| 12/04/2012 12/04/12 | Sold | $101,000 | -2.8% | $112 / Sq Ft |
| 12/04/2012 12/04/12 | For Sale | $103,900 | +3.9% | $115 / Sq Ft |
| 04/20/2012 04/20/12 | Sold | $100,000 | -1.9% | $111 / Sq Ft |
| 03/29/2012 03/29/12 | Pending | -- | -- | -- |
| 03/02/2012 03/02/12 | For Sale | $101,950 | -- | $113 / Sq Ft |
| Year | Tax Paid | Tax Assessment Tax Assessment Total Assessment is a certain percentage of the fair market value that is determined by local assessors to be the total taxable value of land and additions on the property. | Land | Improvement |
|---|---|---|---|---|
| 2025 | $5,143 | $424,481 | $169,786 | $254,695 |
| 2024 | $5,143 | $416,158 | $166,457 | $249,701 |
| 2023 | $5,029 | $407,999 | $163,194 | $244,805 |
| 2022 | $2,749 | $230,519 | $92,205 | $138,314 |
| 2021 | $2,729 | $226,000 | $90,398 | $135,602 |
| 2020 | $2,695 | $223,684 | $89,472 | $134,212 |
| 2019 | $2,646 | $219,299 | $87,718 | $131,581 |
| 2018 | $1,909 | $160,000 | $63,999 | $96,001 |
| 2017 | $1,283 | $107,161 | $42,864 | $64,297 |
| 2016 | $1,262 | $105,061 | $42,024 | $63,037 |
| 2015 | $1,244 | $103,484 | $41,393 | $62,091 |
| 2014 | $1,225 | $101,458 | $40,583 | $60,875 |
Seller's Agent in 2022
Daniel Brandenstein
Compass
(858) 610-6703
2 in this area
15 Total Sales
I
Buyer's Agent in 2022
Isaac Gonzalez
eXp Realty of California Inc
C
Seller's Agent in 2018
Carlos Arias
Dream Realty Inc
Buyer's Agent in 2018
George Bukes
Compass
(808) 256-8028
156 Total Sales
Seller's Agent in 2017
Sean Cartlidge
Finest City Homes & Loans
(619) 865-4556
18 Total Sales
Seller's Agent in 2017
Brandon Long
Regional Realty & Investments Inc.
(619) 990-3179
1 in this area
42 Total Sales
Source: San Diego MLS
MLS Number: 170054207
APN: 471-530-29-01
Disclaimer: Certain information contained herein is derived from information provided by parties other than Homes.com. All information provided is deemed reliable, but is not guaranteed to be accurate and should be independently verified.
![]() This information is deemed reliable but not guaranteed. You should rely on this information only to decide whether or not to further investigate a particular property.
This information is deemed reliable but not guaranteed. You should rely on this information only to decide whether or not to further investigate a particular property.
BEFORE MAKING ANY OTHER DECISION, YOU SHOULD PERSONALLY INVESTIGATE THE FACTS (e.g. square footage and lot size) with the assistance of an appropriate professional. You may use this information only to identify properties you may be interested in investigating further. All uses except for personal, noncommercial use in accordance with the foregoing purpose are prohibited. Redistribution or copying of this information, any photographs or video tours is strictly
prohibited. This information is derived from the Internet Data Exchange (IDX) service provided by San Diego MLS. Displayed property listings may be held by a brokerage firm other than the broker and/or agent responsible for this display. The information and any photographs and video tours and the compilation from which they are derived is protected by copyright. Compilation © 2025 San Diego MLS.