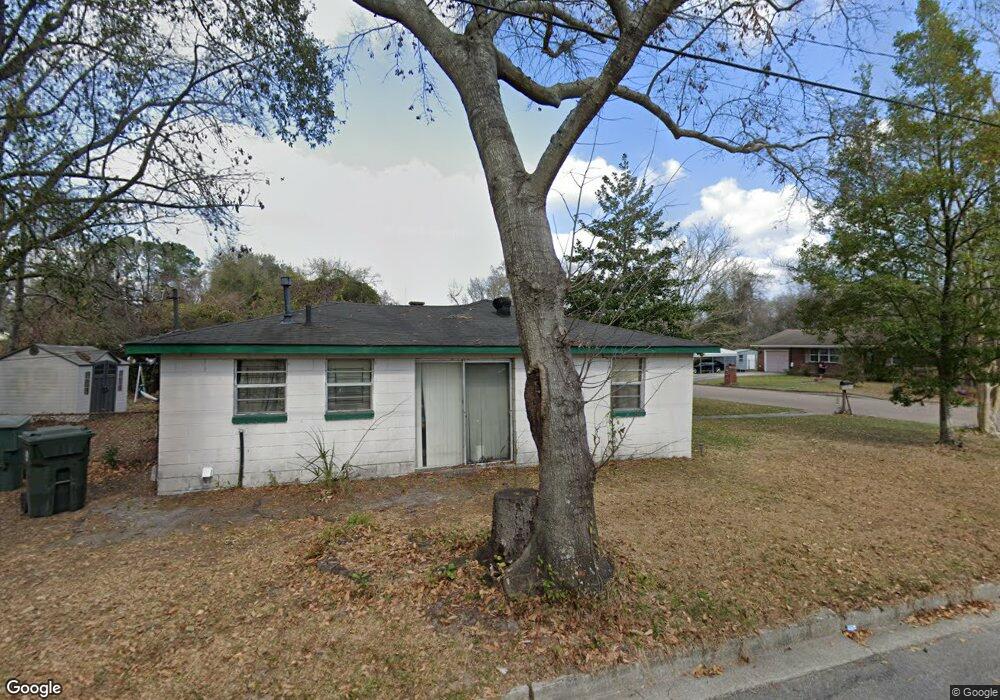
4041 Raybun St Savannah, GA 31405
Liberty City NeighborhoodEstimated Value: $110,000 - $249,000
--
Bed
1
Bath
1,350
Sq Ft
$132/Sq Ft
Est. Value
About This Home
This home is located at 4041 Raybun St, Savannah, GA 31405 and is currently estimated at $177,957, approximately $131 per square foot. 4041 Raybun St is a home located in Chatham County with nearby schools including Butler Elementary School, Derenne Middle School, and Beach High School.
Ownership History
Date
Name
Owned For
Owner Type
Purchase Details
Closed on
Dec 3, 2021
Sold by
Williams Dorothy L
Bought by
Walker Floyd
Current Estimated Value
Purchase Details
Closed on
Dec 24, 2004
Sold by
Adams Luverna and Walker Floyd
Bought by
Williams Dorothy L and Walker Dorothy L
Home Financials for this Owner
Home Financials are based on the most recent Mortgage that was taken out on this home.
Original Mortgage
$45,273
Interest Rate
5.63%
Mortgage Type
New Conventional
Purchase Details
Closed on
Dec 23, 2004
Sold by
Roswell Holdings Tax Liens 2004-2 Llc
Bought by
Williams Dorothy L and Adams Luverna
Home Financials for this Owner
Home Financials are based on the most recent Mortgage that was taken out on this home.
Original Mortgage
$45,273
Interest Rate
5.63%
Mortgage Type
New Conventional
Purchase Details
Closed on
Jul 6, 2004
Sold by
Walker Dorothy Luveran
Bought by
Roswell Holdings Tax Lien 2004-2 Llc
Create a Home Valuation Report for This Property
The Home Valuation Report is an in-depth analysis detailing your home's value as well as a comparison with similar homes in the area
Home Values in the Area
Average Home Value in this Area
Purchase History
| Date | Buyer | Sale Price | Title Company |
|---|---|---|---|
| Walker Floyd | -- | -- | |
| Williams Dorothy L | -- | -- | |
| Williams Dorothy L | -- | -- | |
| Williams Dorothy L | $39,793 | -- | |
| Williams Dorothy L | $39,794 | -- | |
| Roswell Holdings Tax Lien 2004-2 Llc | $28,000 | -- |
Source: Public Records
Mortgage History
| Date | Status | Borrower | Loan Amount |
|---|---|---|---|
| Previous Owner | Williams Dorothy L | $45,273 |
Source: Public Records
Tax History Compared to Growth
Tax History
| Year | Tax Paid | Tax Assessment Tax Assessment Total Assessment is a certain percentage of the fair market value that is determined by local assessors to be the total taxable value of land and additions on the property. | Land | Improvement |
|---|---|---|---|---|
| 2025 | $1,316 | $35,760 | $20,000 | $15,760 |
| 2024 | $1,316 | $32,800 | $18,240 | $14,560 |
| 2023 | $246 | $20,200 | $6,280 | $13,920 |
| 2022 | $299 | $24,480 | $6,280 | $18,200 |
| 2021 | $1,260 | $21,360 | $6,280 | $15,080 |
| 2020 | $565 | $17,880 | $6,280 | $11,600 |
| 2019 | $1,079 | $17,880 | $6,280 | $11,600 |
| 2018 | $1,665 | $18,040 | $6,280 | $11,760 |
| 2017 | $1,922 | $18,280 | $6,280 | $12,000 |
| 2016 | $537 | $18,400 | $6,280 | $12,120 |
| 2015 | $1,920 | $19,040 | $6,320 | $12,720 |
| 2014 | $1,079 | $19,400 | $0 | $0 |
Source: Public Records
Map
Nearby Homes
- 4110 Sumter St
- 1817 Lloyd St
- 0 Fayette St Unit 10573895
- 0 Fayette St Unit SA335446
- 2001 Tuskegee St
- 1816 Tubman St
- 1721 Arcadian St
- 3125 Ogeechee Rd
- 3604 Plymouth Ave
- 2025 Tuskegee St
- 1741 Vassar St
- 2031 Tuskegee St
- 2016 Nash Ave
- 0 Acl Blvd Unit SA335069
- 2814 Julia Law St
- 2009 Comet Ave
- 1913 Champion St
- 000 Acl Blvd
- 113 John Eady Ct
- 115 John Eady Ct