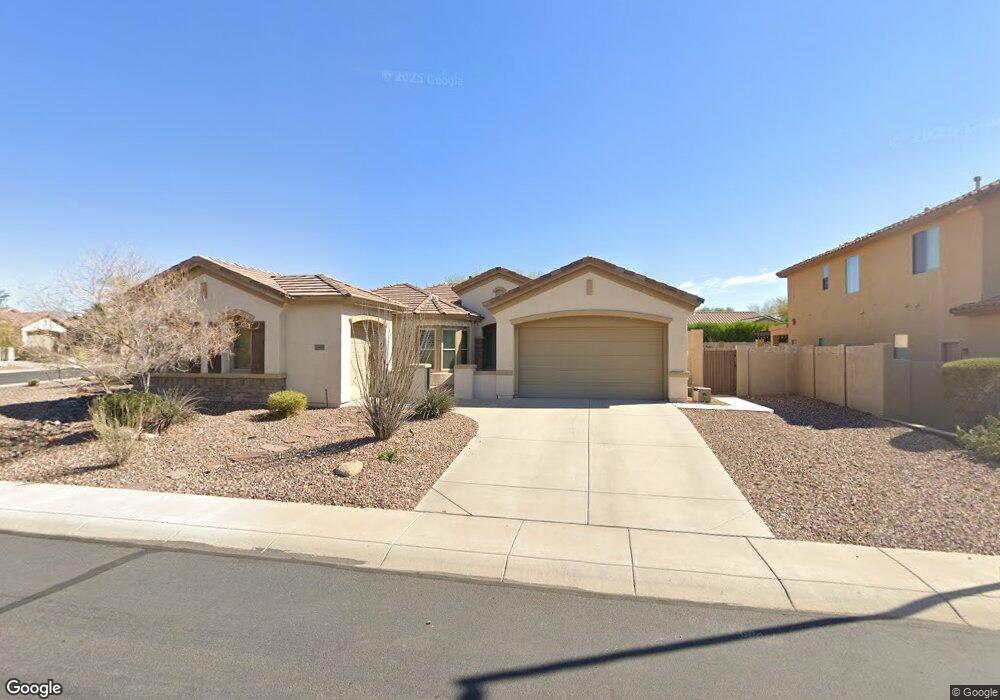
40419 N Graham Way Unit 25 Phoenix, AZ 85086
Estimated Value: $650,100 - $709,000
--
Bed
3
Baths
2,666
Sq Ft
$254/Sq Ft
Est. Value
About This Home
This home is located at 40419 N Graham Way Unit 25, Phoenix, AZ 85086 and is currently estimated at $676,025, approximately $253 per square foot. 40419 N Graham Way Unit 25 is a home located in Maricopa County with nearby schools including Gavilan Peak Elementary School, Boulder Creek High School, and Caurus Academy.
Ownership History
Date
Name
Owned For
Owner Type
Purchase Details
Closed on
Nov 3, 2022
Sold by
Mayhew Christina A
Bought by
Christina A Mayhew Survivors Trust
Current Estimated Value
Purchase Details
Closed on
Jun 18, 2013
Sold by
Mayhew Christina A
Bought by
Mayhew Christina A
Home Financials for this Owner
Home Financials are based on the most recent Mortgage that was taken out on this home.
Original Mortgage
$134,123
Interest Rate
3.38%
Mortgage Type
New Conventional
Purchase Details
Closed on
Oct 10, 2005
Sold by
Mayhew Timothy J and Mayhew Christina A
Bought by
Mayhew Timothy J and Mayhew Christina A
Purchase Details
Closed on
Mar 21, 2003
Sold by
Del Webbs Coventry Homes Inc
Bought by
Mayhew Timothy J and Mayhew Christina A
Home Financials for this Owner
Home Financials are based on the most recent Mortgage that was taken out on this home.
Original Mortgage
$160,000
Interest Rate
5.82%
Mortgage Type
New Conventional
Create a Home Valuation Report for This Property
The Home Valuation Report is an in-depth analysis detailing your home's value as well as a comparison with similar homes in the area
Home Values in the Area
Average Home Value in this Area
Purchase History
| Date | Buyer | Sale Price | Title Company |
|---|---|---|---|
| Christina A Mayhew Survivors Trust | -- | -- | |
| Mayhew Christina A | -- | Accommodation | |
| Mayhew Timothy J | -- | -- | |
| Mayhew Timothy J | $248,456 | Sun Title Agency Co | |
| Del Webbs Coventry Homes Inc | -- | Sun Title Agency Co |
Source: Public Records
Mortgage History
| Date | Status | Borrower | Loan Amount |
|---|---|---|---|
| Previous Owner | Mayhew Christina A | $134,123 | |
| Previous Owner | Mayhew Timothy J | $160,000 |
Source: Public Records
Tax History Compared to Growth
Tax History
| Year | Tax Paid | Tax Assessment Tax Assessment Total Assessment is a certain percentage of the fair market value that is determined by local assessors to be the total taxable value of land and additions on the property. | Land | Improvement |
|---|---|---|---|---|
| 2025 | $3,548 | $32,924 | -- | -- |
| 2024 | $3,325 | $31,356 | -- | -- |
| 2023 | $3,325 | $50,530 | $10,100 | $40,430 |
| 2022 | $3,178 | $33,480 | $6,690 | $26,790 |
| 2021 | $3,273 | $32,150 | $6,430 | $25,720 |
| 2020 | $3,201 | $29,760 | $5,950 | $23,810 |
| 2019 | $3,140 | $28,160 | $5,630 | $22,530 |
| 2018 | $3,041 | $27,020 | $5,400 | $21,620 |
| 2017 | $2,981 | $26,200 | $5,240 | $20,960 |
| 2016 | $2,556 | $26,130 | $5,220 | $20,910 |
| 2015 | $2,480 | $24,570 | $4,910 | $19,660 |
Source: Public Records
Map
Nearby Homes
- 40420 N Chase Oaks Way Unit 25
- 2403 W Kit Carson Ct Unit 25
- 2407 W Warren Dr Unit 35
- 40332 N High Noon Way
- 40131 N Mill Creek Way
- 40127 N Bridlewood Ct Unit 27
- 40533 N Cross Timbers Trail Unit 17
- 39826 N Mill Creek Ct Unit 43
- 2237 W Twain Dr Unit 39
- 2221 W River Rock Trail
- 41019 N Iron Horse Way
- 40614 N Laurel Valley Way Unit 37
- 40128 N Hickok Trail Unit 29
- 2677 W Wayne Ln
- 40802 N Peale Ct
- 41202 N Rolling Green Way
- 40722 N Harbour Town Ct Unit 24
- 2614 W Medinah Way
- 41227 N Rolling Green Way
- 2456 W Clearview Trail Unit 47
- 40413 N Graham Way
- 41029 N High Noon Way
- 40414 N Chase Oaks Way
- 40407 N Graham Way
- 40416 N Graham Way Unit 25
- 40422 N Graham Way Unit 25
- 2454 W Webster Dr
- 2448 W Webster Dr Unit 25
- 40408 N Chase Oaks Way Unit 25
- 2460 W Webster Dr Unit 25
- 2442 W Webster Dr Unit 25
- 40483 N High Noon Way Unit 25
- 40401 N Graham Way
- 2436 W Webster Dr Unit 25
- 40477 N High Noon Way Unit 25
- 40402 N Chase Oaks Way
- 40419 N Chase Oaks Way Unit 25
- 40413 N Chase Oaks Way
- 40507 N Mill Creek Ct Unit 25
- 40501 N Mill Creek Ct