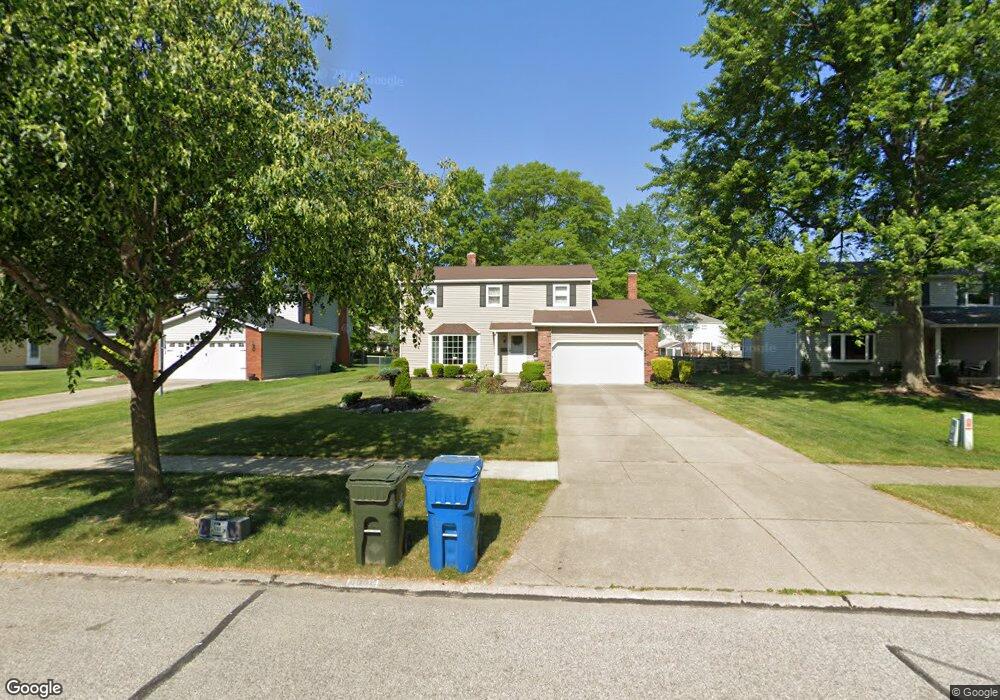
4042 Fielding Dr North Olmsted, OH 44070
Estimated Value: $280,000 - $338,000
4
Beds
2
Baths
1,880
Sq Ft
$163/Sq Ft
Est. Value
About This Home
This home is located at 4042 Fielding Dr, North Olmsted, OH 44070 and is currently estimated at $305,719, approximately $162 per square foot. 4042 Fielding Dr is a home located in Cuyahoga County with nearby schools including Pine Intermediate School, Maple Intermediate Elementary School, and North Olmsted Middle School.
Ownership History
Date
Name
Owned For
Owner Type
Purchase Details
Closed on
May 20, 2015
Sold by
Abdelnour George and Abdelbour Evelyn
Bought by
Abdelnour Rogene
Current Estimated Value
Purchase Details
Closed on
Nov 18, 2014
Sold by
Nour Properties Ii Llc and Abdelnour George
Bought by
Abdelnour George
Purchase Details
Closed on
Dec 18, 2013
Sold by
Abdelnour Nadia M
Bought by
Nour Properties Ii Llc
Purchase Details
Closed on
Feb 22, 1989
Sold by
Mahon Richard E
Bought by
Abdelnour Elias M
Purchase Details
Closed on
May 4, 1984
Sold by
Mahon Richard E and Mahon Ellen P
Bought by
Mahon Richard E
Purchase Details
Closed on
Jan 1, 1975
Bought by
Mahon Richard E and Mahon Ellen P
Create a Home Valuation Report for This Property
The Home Valuation Report is an in-depth analysis detailing your home's value as well as a comparison with similar homes in the area
Home Values in the Area
Average Home Value in this Area
Purchase History
| Date | Buyer | Sale Price | Title Company |
|---|---|---|---|
| Abdelnour Rogene | $134,100 | Attorney | |
| Abdelnour George | -- | Attorney | |
| Nour Properties Ii Llc | -- | Attorney | |
| Abdelnour Elias M | $112,000 | -- | |
| Mahon Richard E | -- | -- | |
| Mahon Richard E | -- | -- |
Source: Public Records
Tax History Compared to Growth
Tax History
| Year | Tax Paid | Tax Assessment Tax Assessment Total Assessment is a certain percentage of the fair market value that is determined by local assessors to be the total taxable value of land and additions on the property. | Land | Improvement |
|---|---|---|---|---|
| 2024 | $6,357 | $92,750 | $20,405 | $72,345 |
| 2023 | $5,680 | $69,550 | $17,190 | $52,360 |
| 2022 | $5,650 | $69,550 | $17,190 | $52,360 |
| 2021 | $5,114 | $69,550 | $17,190 | $52,360 |
| 2020 | $4,692 | $56,530 | $13,970 | $42,560 |
| 2019 | $4,521 | $159,900 | $39,900 | $120,000 |
| 2018 | $4,585 | $55,970 | $13,970 | $42,000 |
| 2017 | $4,346 | $48,830 | $11,340 | $37,490 |
| 2016 | $4,308 | $48,830 | $11,340 | $37,490 |
| 2015 | -- | $48,830 | $11,340 | $37,490 |
| 2014 | -- | $46,940 | $10,920 | $36,020 |
Source: Public Records
Map
Nearby Homes
- 25775 Briarwood Ct
- 3844 Woodpath Trail
- 4429 Canterbury Rd
- 26646 Sweetbriar Dr
- 25148 Tara Lynn Dr
- 26716 Chapel Hill Dr
- 3595 Canterbury Rd
- 25077 Doe Dr
- 4187 Columbia Rd Unit 126
- 26910 Sudbury Dr
- 26454 Strawberry Ln
- 25735 Lorain Rd Unit 218
- 25735 Lorain Rd Unit 121
- 24758 Doe Dr
- 26726 Leenders Ln
- 25255 Maple Ridge Rd
- 3781 Dover Center Rd
- 25400 Maple Ridge Rd
- 3517 Walter Rd
- 25360 Hall Dr
- 4056 Fielding Dr
- 4028 Fielding Dr
- 4014 Fielding 4ftc
- 4014 Fielding Dr
- 4041 Lydgate Dr
- 4055 Lydgate Dr
- 4027 Lydgate Dr
- 4011 Lydgate Dr
- 4069 Lydgate Dr
- 4049 Fielding Dr
- 4000 Fielding Dr
- 4084 Fielding Dr
- 4035 Fielding Dr
- 4061 Fielding Dr
- 4021 Fielding Dr
- 3999 Lydgate Dr
- 4083 Lydgate Dr
- 4075 Fielding Dr
- 4007 Fielding Dr
- 4098 Fielding Dr