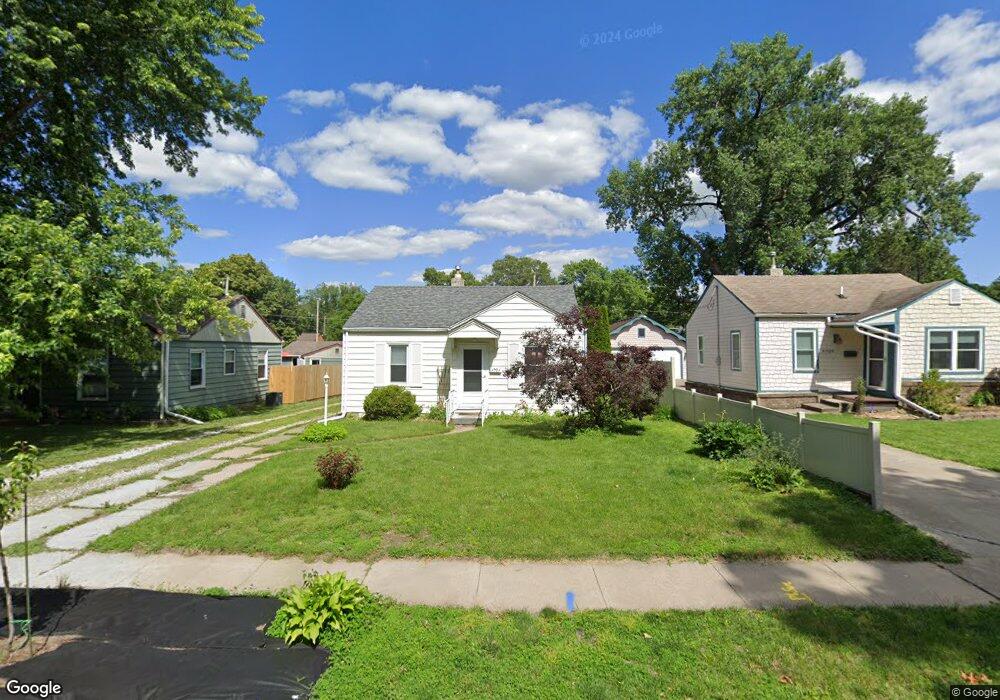
4043 1st St Des Moines, IA 50313
Highland Park NeighborhoodEstimated Value: $146,000 - $176,000
2
Beds
1
Bath
652
Sq Ft
$245/Sq Ft
Est. Value
About This Home
This home is located at 4043 1st St, Des Moines, IA 50313 and is currently estimated at $159,818, approximately $245 per square foot. 4043 1st St is a home located in Polk County with nearby schools including Madison Elementary School, Harding Middle School, and North High School.
Ownership History
Date
Name
Owned For
Owner Type
Purchase Details
Closed on
May 21, 2012
Sold by
Kline Scott
Bought by
Engstrom Valerie and Kline Valerie
Current Estimated Value
Purchase Details
Closed on
May 22, 2000
Sold by
Carlson William E and Parsons John R
Bought by
Kline Scott and Kline Valerie L
Home Financials for this Owner
Home Financials are based on the most recent Mortgage that was taken out on this home.
Original Mortgage
$47,607
Outstanding Balance
$16,494
Interest Rate
8.18%
Mortgage Type
FHA
Estimated Equity
$143,324
Create a Home Valuation Report for This Property
The Home Valuation Report is an in-depth analysis detailing your home's value as well as a comparison with similar homes in the area
Home Values in the Area
Average Home Value in this Area
Purchase History
| Date | Buyer | Sale Price | Title Company |
|---|---|---|---|
| Engstrom Valerie | -- | None Available | |
| Kline Scott | $47,500 | -- |
Source: Public Records
Mortgage History
| Date | Status | Borrower | Loan Amount |
|---|---|---|---|
| Open | Kline Scott | $47,607 |
Source: Public Records
Tax History Compared to Growth
Tax History
| Year | Tax Paid | Tax Assessment Tax Assessment Total Assessment is a certain percentage of the fair market value that is determined by local assessors to be the total taxable value of land and additions on the property. | Land | Improvement |
|---|---|---|---|---|
| 2025 | $2,574 | $149,000 | $31,800 | $117,200 |
| 2024 | $2,574 | $130,800 | $27,500 | $103,300 |
| 2023 | $2,586 | $130,800 | $27,500 | $103,300 |
| 2022 | $2,566 | $109,700 | $24,000 | $85,700 |
| 2021 | $2,396 | $109,700 | $24,000 | $85,700 |
| 2020 | $2,488 | $96,000 | $20,900 | $75,100 |
| 2019 | $2,300 | $96,000 | $20,900 | $75,100 |
| 2018 | $2,278 | $85,600 | $18,100 | $67,500 |
| 2017 | $2,118 | $85,600 | $18,100 | $67,500 |
| 2016 | $1,926 | $78,300 | $16,300 | $62,000 |
| 2015 | $1,926 | $73,100 | $16,300 | $56,800 |
| 2014 | $1,946 | $76,000 | $16,500 | $59,500 |
Source: Public Records
Map
Nearby Homes