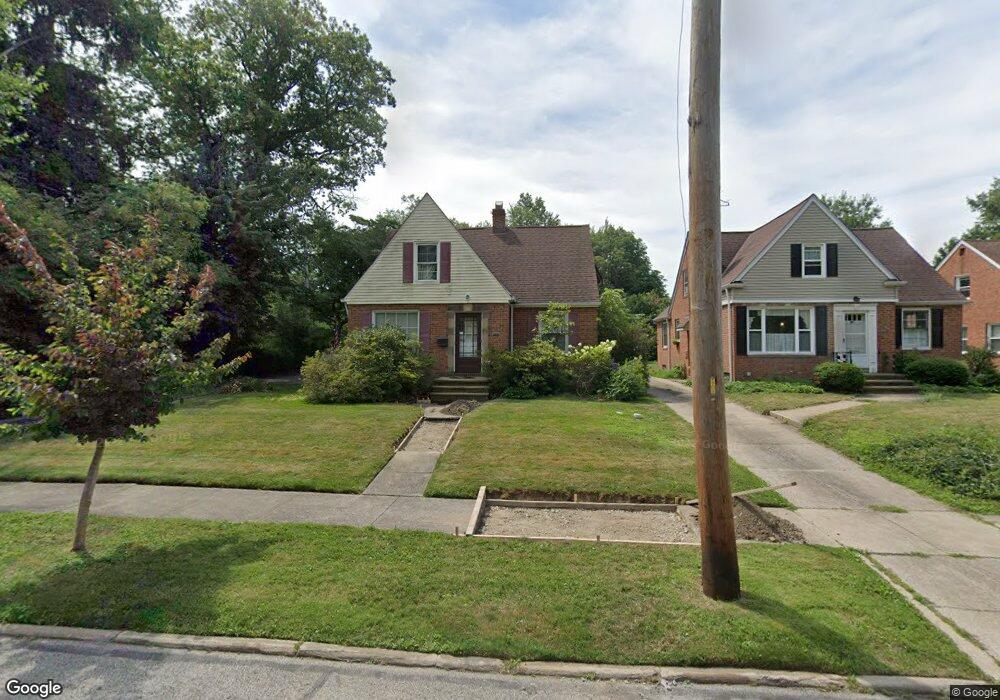
4044 Ardmore Rd Cleveland, OH 44121
Monticello-Noble NeighborhoodEstimated Value: $164,000 - $177,000
3
Beds
2
Baths
1,339
Sq Ft
$127/Sq Ft
Est. Value
About This Home
This home is located at 4044 Ardmore Rd, Cleveland, OH 44121 and is currently estimated at $169,433, approximately $126 per square foot. 4044 Ardmore Rd is a home located in Cuyahoga County with nearby schools including Noble Elementary School, Monticello Middle School, and Cleveland Heights High School.
Ownership History
Date
Name
Owned For
Owner Type
Purchase Details
Closed on
May 29, 2003
Sold by
Pham Quynhanh H T
Bought by
Tomazin Kimberly L
Current Estimated Value
Home Financials for this Owner
Home Financials are based on the most recent Mortgage that was taken out on this home.
Original Mortgage
$104,263
Outstanding Balance
$46,069
Interest Rate
5.9%
Mortgage Type
FHA
Estimated Equity
$123,364
Purchase Details
Closed on
May 29, 1999
Sold by
Estate Of Sophie Finizia
Bought by
Myring Rosemary and Finizia Joseph
Purchase Details
Closed on
May 28, 1998
Sold by
Myring Rosemary and Finizia Joseph
Bought by
Pham Quynhanh H T
Home Financials for this Owner
Home Financials are based on the most recent Mortgage that was taken out on this home.
Original Mortgage
$77,900
Interest Rate
7.27%
Purchase Details
Closed on
Apr 15, 1993
Sold by
Sophie Finizia
Bought by
Myring Rosemary
Purchase Details
Closed on
Nov 12, 1980
Sold by
Finizia Anthony and Finizia Sophie
Bought by
Sophie Finizia
Purchase Details
Closed on
Jan 1, 1975
Bought by
Finizia Anthony and Finizia Sophie
Create a Home Valuation Report for This Property
The Home Valuation Report is an in-depth analysis detailing your home's value as well as a comparison with similar homes in the area
Home Values in the Area
Average Home Value in this Area
Purchase History
| Date | Buyer | Sale Price | Title Company |
|---|---|---|---|
| Tomazin Kimberly L | $105,900 | Reliance Title | |
| Myring Rosemary | -- | -- | |
| Pham Quynhanh H T | $82,000 | -- | |
| Myring Rosemary | -- | -- | |
| Sophie Finizia | -- | -- | |
| Finizia Anthony | -- | -- |
Source: Public Records
Mortgage History
| Date | Status | Borrower | Loan Amount |
|---|---|---|---|
| Open | Tomazin Kimberly L | $104,263 | |
| Previous Owner | Pham Quynhanh H T | $77,900 |
Source: Public Records
Tax History Compared to Growth
Tax History
| Year | Tax Paid | Tax Assessment Tax Assessment Total Assessment is a certain percentage of the fair market value that is determined by local assessors to be the total taxable value of land and additions on the property. | Land | Improvement |
|---|---|---|---|---|
| 2024 | $4,849 | $54,040 | $12,040 | $42,000 |
| 2023 | $3,700 | $33,430 | $9,140 | $24,290 |
| 2022 | $3,682 | $33,430 | $9,140 | $24,290 |
| 2021 | $3,608 | $33,430 | $9,140 | $24,290 |
| 2020 | $3,595 | $30,100 | $8,230 | $21,880 |
| 2019 | $3,400 | $86,000 | $23,500 | $62,500 |
| 2018 | $3,465 | $30,100 | $8,230 | $21,880 |
| 2017 | $3,725 | $30,770 | $7,350 | $23,420 |
| 2016 | $3,718 | $30,770 | $7,350 | $23,420 |
| 2015 | $3,781 | $30,770 | $7,350 | $23,420 |
| 2014 | $3,781 | $33,080 | $7,910 | $25,170 |
Source: Public Records
Map
Nearby Homes
- 1292 Plainfield Rd
- 1264 Plainfield Rd
- 1356 Plainfield Rd
- 3983 Ardmore Rd
- 1271 Winston Rd
- 1268 Avondale Rd
- 1231 Winston Rd
- 2884 Noble Rd
- 3983 Elmwood Rd
- 1400 Avondale Rd
- 1391 Avondale Rd
- 1157 Erieview Rd
- 1161 Pomona Rd
- 1148 Sylvania Rd
- 1136 Erieview Rd
- 1166 Argonne Rd
- 1477 Genesee Rd
- 3861 Kirkwood Rd
- 1129 Avondale Rd
- 1164 S Belvoir Blvd
- 4036 Ardmore Rd
- 1296 Plainfield Rd
- 1300 Plainfield Rd
- 1304 Plainfield Rd
- 4032 Ardmore Rd
- 1310 Plainfield Rd
- 1243 Sylvania Rd
- 1314 Plainfield Rd
- 4028 Ardmore Rd
- 1284 Plainfield Rd
- 1318 Plainfield Rd
- 1239 Sylvania Rd
- 1278 Plainfield Rd
- 4022 Ardmore Rd
- 1324 Plainfield Rd
- 1237 Sylvania Rd
- 1274 Plainfield Rd
- 1330 Plainfield Rd
- 4023 Ardmore Rd
- 1270 Plainfield Rd