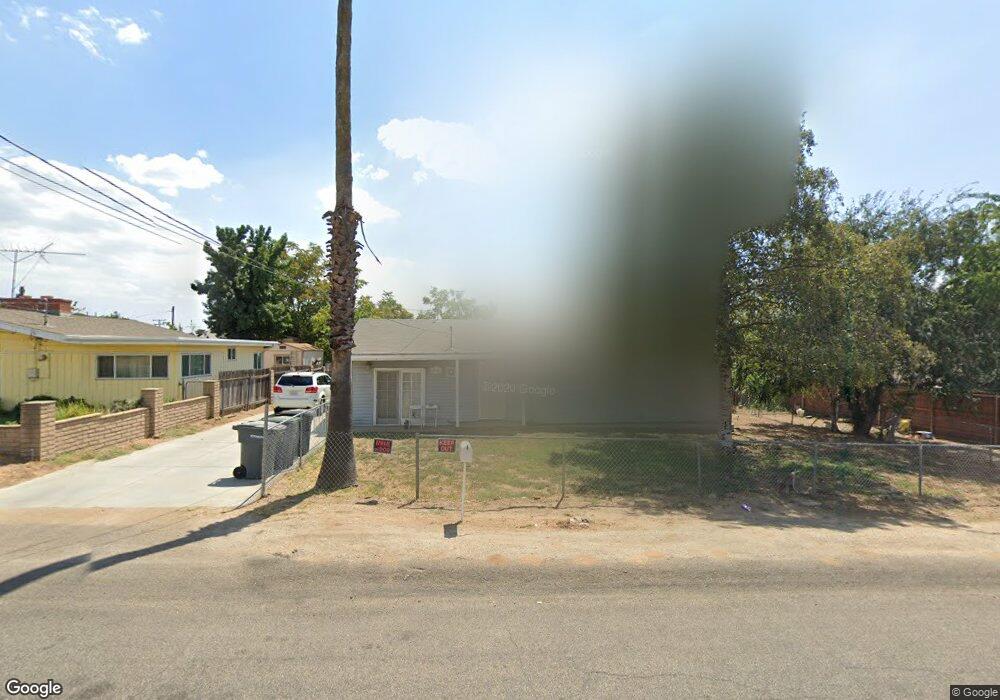
40441 High St Cherry Valley, CA 92223
Estimated Value: $261,000 - $369,000
3
Beds
1
Bath
875
Sq Ft
$378/Sq Ft
Est. Value
About This Home
This home is located at 40441 High St, Cherry Valley, CA 92223 and is currently estimated at $331,134, approximately $378 per square foot. 40441 High St is a home located in Riverside County with nearby schools including Brookside Elementary School, Mountain View Middle School, and Beaumont Senior High School.
Ownership History
Date
Name
Owned For
Owner Type
Purchase Details
Closed on
Sep 14, 2009
Sold by
Wells Fargo Bank Na
Bought by
Ledbetter Steven W
Current Estimated Value
Purchase Details
Closed on
Apr 30, 2009
Sold by
Sexton James E
Bought by
Wells Fargo Bank Na
Purchase Details
Closed on
Feb 24, 2006
Sold by
Hundley Gregory Mark and Hundley Rachel Ann
Bought by
Sexton James E
Home Financials for this Owner
Home Financials are based on the most recent Mortgage that was taken out on this home.
Original Mortgage
$236,000
Interest Rate
6.99%
Mortgage Type
Balloon
Purchase Details
Closed on
Aug 30, 2004
Sold by
Gilpin Donna M
Bought by
Hundley Gregory Mark and Hundley Rachel Ann
Home Financials for this Owner
Home Financials are based on the most recent Mortgage that was taken out on this home.
Original Mortgage
$218,077
Interest Rate
5.76%
Mortgage Type
FHA
Purchase Details
Closed on
Jun 16, 2004
Sold by
Gilpin Fredric B
Bought by
Gilpin Donna
Create a Home Valuation Report for This Property
The Home Valuation Report is an in-depth analysis detailing your home's value as well as a comparison with similar homes in the area
Home Values in the Area
Average Home Value in this Area
Purchase History
| Date | Buyer | Sale Price | Title Company |
|---|---|---|---|
| Ledbetter Steven W | $61,500 | Lsi Title Company Ca | |
| Wells Fargo Bank Na | $83,700 | None Available | |
| Sexton James E | $295,000 | United Title Company Inland | |
| Hundley Gregory Mark | $221,500 | New Century Title Company | |
| Gilpin Donna | -- | New Century Title Company |
Source: Public Records
Mortgage History
| Date | Status | Borrower | Loan Amount |
|---|---|---|---|
| Previous Owner | Sexton James E | $236,000 | |
| Previous Owner | Hundley Gregory Mark | $218,077 |
Source: Public Records
Tax History
| Year | Tax Paid | Tax Assessment Tax Assessment Total Assessment is a certain percentage of the fair market value that is determined by local assessors to be the total taxable value of land and additions on the property. | Land | Improvement |
|---|---|---|---|---|
| 2025 | $1,074 | $79,367 | $19,353 | $60,014 |
| 2023 | $1,074 | $76,287 | $18,602 | $57,685 |
| 2022 | $1,058 | $74,792 | $18,238 | $56,554 |
| 2021 | $1,039 | $73,327 | $17,881 | $55,446 |
| 2020 | $1,026 | $72,576 | $17,698 | $54,878 |
| 2019 | $1,010 | $71,153 | $17,351 | $53,802 |
| 2018 | $1,006 | $69,759 | $17,011 | $52,748 |
| 2017 | $989 | $68,392 | $16,678 | $51,714 |
| 2016 | $963 | $67,051 | $16,351 | $50,700 |
| 2015 | $947 | $66,046 | $16,106 | $49,940 |
| 2014 | $948 | $64,754 | $15,792 | $48,962 |
Source: Public Records
Map
Nearby Homes
- 40587 High St
- 40587 Dutton St
- 10435 Frontier Trail
- 10165 Frontier Trail
- 10475 Frontier Trail
- 40795 Laredo Trail
- 10500 Frontier Trail
- 40848 Laredo Trail
- 40896 Oregon Trail
- 10751 Deerfield Dr
- 10002 Frontier Trail
- 40471 Rome Beauty Way
- 10650 Bel Air Dr
- 10123 Pawnee Cir
- 10885 Jonathan Ave
- 10676 Cherry Hills Dr
- 41238 Cheyenne Trail
- 40975 Laredo Trail
- 41030 Inverness Cir
- 41004 Cheyenne Trail
- 40443 High St
- 40433 High St
- 40445 High St
- 10401 Winesap Ave
- 10425 Winesap Ave
- 40427 High St
- 10381 Winesap Ave
- 40490 High St
- 10455 Winesap Ave
- 40417 High St
- 7 N Winesap Ave
- 9933 Winesap Ave
- 10674 Winesap Ave
- 10030 Winesap Ave
- 0 Winesap Ave Unit IV18125315
- 0 Winesap Ave Unit E08013662
- 0 Winesap Ave Unit IV17231510
- 0 Winesap Ave Unit IV16027203
- 0 Winesap Ave Unit IV16150109
- 0 Winesap Ave Unit IV21133811
Your Personal Tour Guide
Ask me questions while you tour the home.