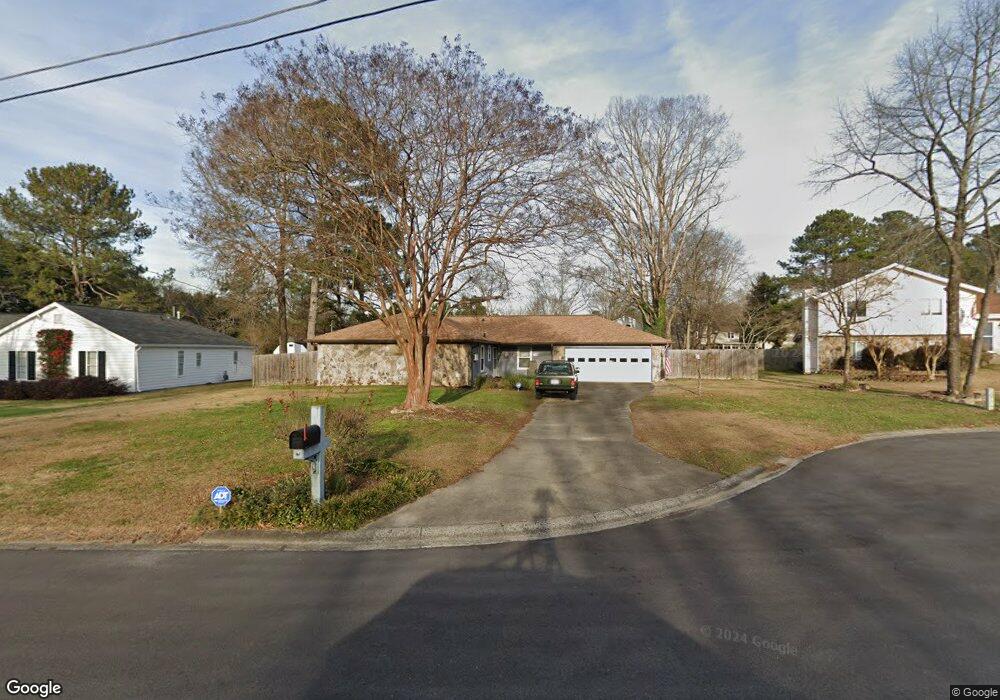
4045 Ardmore Ct Duluth, GA 30096
Estimated Value: $429,000 - $488,000
3
Beds
2
Baths
2,112
Sq Ft
$216/Sq Ft
Est. Value
About This Home
This home is located at 4045 Ardmore Ct, Duluth, GA 30096 and is currently estimated at $456,743, approximately $216 per square foot. 4045 Ardmore Ct is a home located in Gwinnett County with nearby schools including Chattahoochee Elementary School, Coleman Middle School, and Duluth High School.
Ownership History
Date
Name
Owned For
Owner Type
Purchase Details
Closed on
Aug 31, 2018
Sold by
Jones Nancy Bentley
Bought by
Jones Karen N
Current Estimated Value
Home Financials for this Owner
Home Financials are based on the most recent Mortgage that was taken out on this home.
Original Mortgage
$190,272
Outstanding Balance
$165,264
Interest Rate
4.6%
Mortgage Type
FHA
Estimated Equity
$291,479
Purchase Details
Closed on
Apr 14, 2017
Sold by
Jones Nancy B
Bought by
Jones Karen Nancy
Purchase Details
Closed on
Feb 16, 2016
Sold by
Jones Karen Nancy
Bought by
Jones Karen Nancy and Jones Nancy Bentley
Purchase Details
Closed on
Oct 30, 2013
Sold by
Jones Karen Nancy
Bought by
Thomas Michele Elizabeth
Purchase Details
Closed on
Aug 21, 2008
Sold by
Ownbey Ronald L
Bought by
Jones Karen N
Home Financials for this Owner
Home Financials are based on the most recent Mortgage that was taken out on this home.
Original Mortgage
$160,380
Interest Rate
6.32%
Mortgage Type
FHA
Create a Home Valuation Report for This Property
The Home Valuation Report is an in-depth analysis detailing your home's value as well as a comparison with similar homes in the area
Home Values in the Area
Average Home Value in this Area
Purchase History
| Date | Buyer | Sale Price | Title Company |
|---|---|---|---|
| Jones Karen N | -- | -- | |
| Jones Karen Nancy | -- | -- | |
| Jones Karen Nancy | -- | -- | |
| Thomas Michele Elizabeth | -- | -- | |
| Jones Karen N | $176,000 | -- |
Source: Public Records
Mortgage History
| Date | Status | Borrower | Loan Amount |
|---|---|---|---|
| Open | Jones Karen N | $190,272 | |
| Previous Owner | Jones Karen N | $160,380 |
Source: Public Records
Tax History Compared to Growth
Tax History
| Year | Tax Paid | Tax Assessment Tax Assessment Total Assessment is a certain percentage of the fair market value that is determined by local assessors to be the total taxable value of land and additions on the property. | Land | Improvement |
|---|---|---|---|---|
| 2025 | $1,197 | $171,040 | $27,880 | $143,160 |
| 2024 | $4,908 | $172,800 | $31,200 | $141,600 |
| 2023 | $4,908 | $161,520 | $22,000 | $139,520 |
| 2022 | $4,332 | $134,960 | $22,000 | $112,960 |
| 2021 | $3,431 | $104,600 | $18,000 | $86,600 |
| 2020 | $3,235 | $97,880 | $16,000 | $81,880 |
| 2019 | $3,929 | $97,880 | $16,000 | $81,880 |
| 2018 | $2,600 | $78,520 | $12,800 | $65,720 |
| 2016 | $1,900 | $63,080 | $11,600 | $51,480 |
| 2015 | $2,152 | $58,680 | $11,600 | $47,080 |
| 2014 | $1,788 | $58,680 | $11,600 | $47,080 |
Source: Public Records
Map
Nearby Homes
- 3446 Courtenay Ct
- 4085 River Green Pkwy
- 3469 Silver Maple Dr Unit A
- 4088 Suzanne Ln
- 3476 Silver Maple Dr
- 121 Brittany Ct
- 113 Brittany Ct
- 4134 Rogers Creek Ct Unit 41
- 3229 Richwood Dr
- 4188 Rogers Creek Ct Unit 56
- 4160 Darby Way
- 515 Bedfort Dr
- 509 Bedfort Dr
- 3533 Mulberry Way
- 717 Beaufort Cir
- 4109 Abbotts Bridge Rd
- 3081 Frankie Ln
- 4349 Abbotts Bridge Rd
- 3622 S Whippoorwill Dr
- 4055 Ardmore Ct Unit 6
- 4035 Ardmore Ct
- 4044 Chaderton Ct Unit 7
- 4054 Chaderton Ct
- 4025 Ardmore Ct
- 4034 Chaderton Ct
- 0 Ardmore Ct Unit 8401949
- 0 Ardmore Ct Unit 8360905
- 0 Ardmore Ct Unit 8133936
- 4046 Ardmore Ct Unit 6
- 4036 Ardmore Ct Unit 6
- 4056 Ardmore Ct Unit 6
- 4026 Heathmoor Ct
- 4016 Heathmoor Ct
- 4024 Chaderton Ct
- 3505 Berwick South Dr
- 3505 Berwick Dr S
- 3495 Berwick South Dr
- 3495 Berwick Dr S
- 4007 Haverford Ct Unit 6