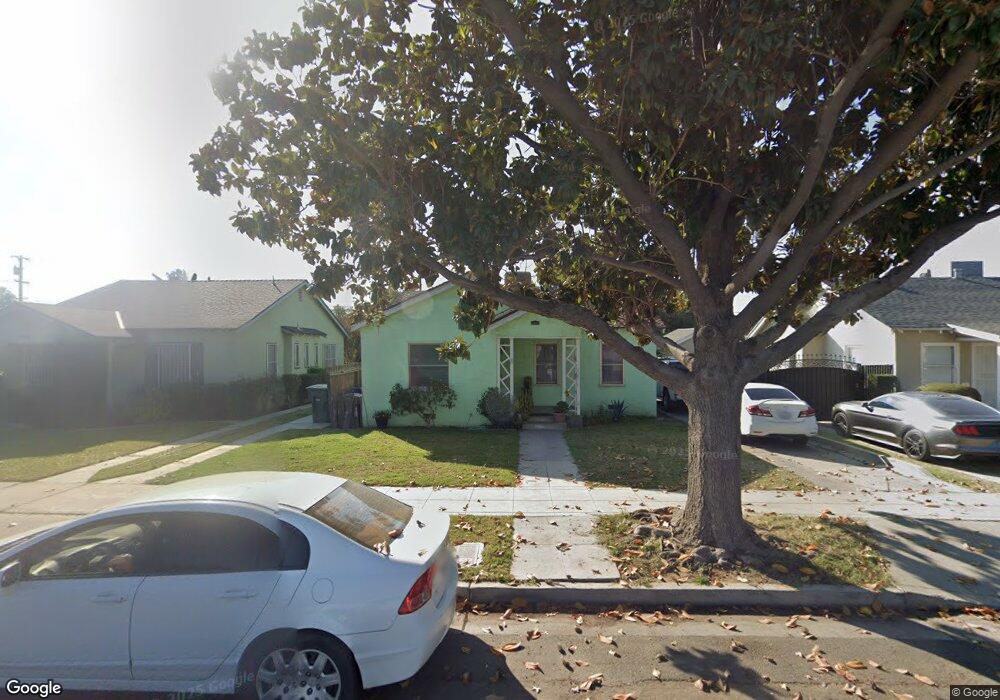
4046 E Lowe Ave Fresno, CA 93702
Huntington NeighborhoodEstimated Value: $203,163 - $250,000
2
Beds
1
Bath
994
Sq Ft
$228/Sq Ft
Est. Value
About This Home
This home is located at 4046 E Lowe Ave, Fresno, CA 93702 and is currently estimated at $226,721, approximately $228 per square foot. 4046 E Lowe Ave is a home located in Fresno County with nearby schools including Winchell Elementary School, Sequoia Middle School, and Roosevelt High School.
Ownership History
Date
Name
Owned For
Owner Type
Purchase Details
Closed on
Aug 26, 2009
Sold by
Aurora Loan Services Llc
Bought by
Ortiz Jorge and Ortiz Sonia Macias
Current Estimated Value
Purchase Details
Closed on
Aug 12, 2009
Sold by
Contreras Hector Pulido
Bought by
Aurora Loan Services Llc
Purchase Details
Closed on
Jun 10, 1999
Sold by
Hall Elvin
Bought by
Contreras Hector Pulido
Home Financials for this Owner
Home Financials are based on the most recent Mortgage that was taken out on this home.
Original Mortgage
$63,391
Interest Rate
7.05%
Mortgage Type
FHA
Purchase Details
Closed on
Dec 23, 1998
Sold by
Takahashi Ronald and Hadden Md David M
Bought by
Hall Elvin
Home Financials for this Owner
Home Financials are based on the most recent Mortgage that was taken out on this home.
Original Mortgage
$41,000
Interest Rate
6.77%
Create a Home Valuation Report for This Property
The Home Valuation Report is an in-depth analysis detailing your home's value as well as a comparison with similar homes in the area
Home Values in the Area
Average Home Value in this Area
Purchase History
| Date | Buyer | Sale Price | Title Company |
|---|---|---|---|
| Ortiz Jorge | $44,500 | Chicago Title Company | |
| Aurora Loan Services Llc | $203,639 | Servicelink | |
| Contreras Hector Pulido | $64,000 | Chicago Title Co | |
| Hall Elvin | $35,000 | Chicago Title Co |
Source: Public Records
Mortgage History
| Date | Status | Borrower | Loan Amount |
|---|---|---|---|
| Previous Owner | Contreras Hector Pulido | $63,391 | |
| Previous Owner | Hall Elvin | $41,000 | |
| Closed | Contreras Hector Pulido | $1,830 |
Source: Public Records
Tax History
| Year | Tax Paid | Tax Assessment Tax Assessment Total Assessment is a certain percentage of the fair market value that is determined by local assessors to be the total taxable value of land and additions on the property. | Land | Improvement |
|---|---|---|---|---|
| 2025 | $760 | $56,786 | $32,265 | $24,521 |
| 2023 | $718 | $54,583 | $31,013 | $23,570 |
| 2022 | $708 | $53,513 | $30,405 | $23,108 |
| 2021 | $689 | $52,464 | $29,809 | $22,655 |
| 2020 | $686 | $51,927 | $29,504 | $22,423 |
| 2019 | $661 | $50,910 | $28,926 | $21,984 |
| 2018 | $647 | $49,912 | $28,359 | $21,553 |
| 2017 | $1,208 | $48,934 | $27,803 | $21,131 |
| 2016 | $615 | $47,975 | $27,258 | $20,717 |
| 2015 | $606 | $47,255 | $26,849 | $20,406 |
| 2014 | $593 | $46,331 | $26,324 | $20,007 |
Source: Public Records
Map
Nearby Homes
- 3984 E Butler Ave
- 3366 E Butler Ave
- 907 S 7th St
- 3626 E Lowe Ave
- 1456 S Chance Ave
- 622 S 11th St
- 3528 E Lowe Ave
- 3533 E Alta Ave
- 523 S 8th St
- 3844 E Balch Ave
- 3459 E Lowe Ave
- 3431 E Lowe Ave
- 3402 E Townsend Ave
- 832 S 4th St
- 2071 S Cedar Ave
- 3804 E Kerckhoff Ave
- 3321 E Montecito Ave
- 1628 S Hazelwood Blvd
- 4584 E Inyo St
- 3231 E Townsend Ave
- 4052 E Lowe Ave
- 4038 E Lowe Ave
- 4058 E Lowe Ave
- 4030 E Lowe Ave
- 4066 E Lowe Ave
- 4045 E Liberty Ave
- 4022 E Lowe Ave
- 4033 E Liberty Ave
- 4055 E Liberty Ave
- 4063 E Liberty Ave
- 4027 E Liberty Ave
- 4045 E Lowe Ave
- 4074 E Lowe Ave
- 4037 E Lowe Ave
- 4053 E Lowe Ave
- 4014 E Lowe Ave
- 4071 E Liberty Ave
- 4019 E Liberty Ave
- 4061 E Lowe Ave
- 4029 E Lowe Ave
Your Personal Tour Guide
Ask me questions while you tour the home.