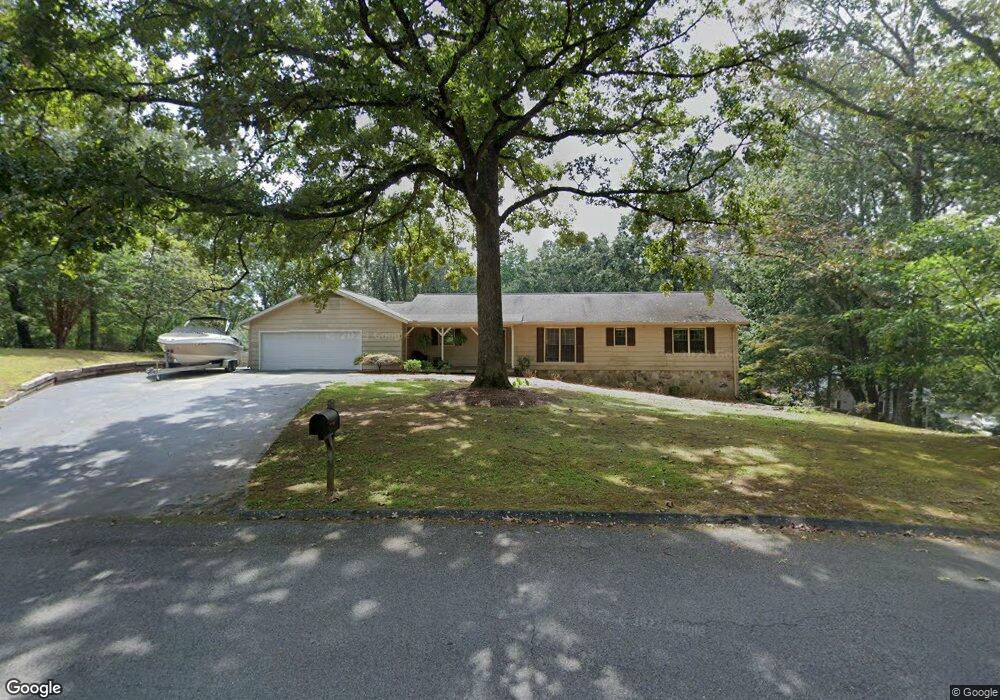
4046 Oak Harbour Dr Gainesville, GA 30506
Estimated Value: $395,000 - $490,000
3
Beds
3
Baths
1,972
Sq Ft
$224/Sq Ft
Est. Value
About This Home
This home is located at 4046 Oak Harbour Dr, Gainesville, GA 30506 and is currently estimated at $440,840, approximately $223 per square foot. 4046 Oak Harbour Dr is a home located in Hall County with nearby schools including Mount Vernon Elementary School, North Hall Middle School, and North Hall High School.
Ownership History
Date
Name
Owned For
Owner Type
Purchase Details
Closed on
May 7, 2021
Sold by
Gamm Terence Edward
Bought by
Gamm Terence Edward and Gamm Kathi G
Current Estimated Value
Home Financials for this Owner
Home Financials are based on the most recent Mortgage that was taken out on this home.
Original Mortgage
$176,000
Outstanding Balance
$159,500
Interest Rate
3.1%
Mortgage Type
New Conventional
Estimated Equity
$281,340
Purchase Details
Closed on
Aug 15, 2007
Sold by
Black Harold A and Black Cathy S
Bought by
Gamm Terence Edward
Home Financials for this Owner
Home Financials are based on the most recent Mortgage that was taken out on this home.
Original Mortgage
$214,400
Interest Rate
6.56%
Mortgage Type
New Conventional
Purchase Details
Closed on
Feb 16, 1999
Sold by
Black Harold A
Bought by
Black Harold Anthony and Black Cathy S
Purchase Details
Closed on
Nov 1, 1986
Sold by
Black Harold Anthony
Bought by
Tapp James Michael and Jennifer Lee
Create a Home Valuation Report for This Property
The Home Valuation Report is an in-depth analysis detailing your home's value as well as a comparison with similar homes in the area
Home Values in the Area
Average Home Value in this Area
Purchase History
| Date | Buyer | Sale Price | Title Company |
|---|---|---|---|
| Gamm Terence Edward | -- | -- | |
| Gamm Terence Edward | $268,000 | -- | |
| Black Harold Anthony | -- | -- | |
| Tapp James Michael | -- | -- |
Source: Public Records
Mortgage History
| Date | Status | Borrower | Loan Amount |
|---|---|---|---|
| Open | Gamm Terence Edward | $176,000 | |
| Previous Owner | Gamm Terence Edward | $214,400 |
Source: Public Records
Tax History Compared to Growth
Tax History
| Year | Tax Paid | Tax Assessment Tax Assessment Total Assessment is a certain percentage of the fair market value that is determined by local assessors to be the total taxable value of land and additions on the property. | Land | Improvement |
|---|---|---|---|---|
| 2024 | $3,384 | $133,988 | $16,440 | $117,548 |
| 2023 | $2,857 | $130,548 | $16,440 | $114,108 |
| 2022 | $2,897 | $111,628 | $16,440 | $95,188 |
| 2021 | $2,933 | $110,988 | $16,440 | $94,548 |
| 2020 | $2,892 | $106,348 | $15,160 | $91,188 |
| 2019 | $2,925 | $106,628 | $15,160 | $91,468 |
| 2018 | $2,881 | $101,668 | $15,160 | $86,508 |
| 2017 | $1,503 | $53,276 | $7,800 | $45,476 |
| 2016 | $1,468 | $53,276 | $7,800 | $45,476 |
| 2015 | $1,479 | $53,276 | $7,800 | $45,476 |
| 2014 | $1,479 | $53,276 | $7,800 | $45,476 |
Source: Public Records
Map
Nearby Homes
- 3911 Oak Harbour Dr
- 3927 Mount Vernon Rd
- 4140 Riverbrook Terrace
- 4156 Riverbrook Terrace
- 4136 Riverbrook Terrace
- 4132 Riverbrook Terrace
- 4118 Riverbrook Terrace
- 4121 Riverbrook Terrace
- 4076 Fairmont St
- 3853 Alexandria Dr
- 3911 Fraser Cir
- 3712 Corinth Dr
- 3743 Corinth Dr
- 4315 Post Oak Point
- York Plan at Somerset at Riverbrook
- Cole Plan at Somerset at Riverbrook
- Cheyenne Plan at Somerset at Riverbrook
- 3860 Billabong Trail Unit 87
- 4007 Oark Harbour Cir Unit 34-36
- 3941 Oak Harbour Dr
- 4007 Oak Harbour Cir
- 4007 Oak Harbour Cir Unit 34-36
- 4051 Oak Harbour Dr
- 4038 Oak Harbour Dr
- 3937 Oak Harbour Dr
- 4039 Oak Harbour Dr
- 3951 Oak Harbour Dr
- 4006 Oak Harbour Cir
- Lot 48 Oak Harbour Dr
- Lot 47 Oak Harbour Dr
- 0 Lot 48 Oak Harbour Dr Unit 8276260
- 3931 Oak Harbour Dr
- 0 Oak Harbour Cir Unit 8650655
- 0 Oak Harbour Cir Unit 8982655
- 0 Oak Harbour Cir Unit 8963780
- 0 Oak Harbour Cir Unit 8752170
- 0 Oak Harbour Cir Unit 8769111
- 0 Oak Harbour Cir Unit 8815148