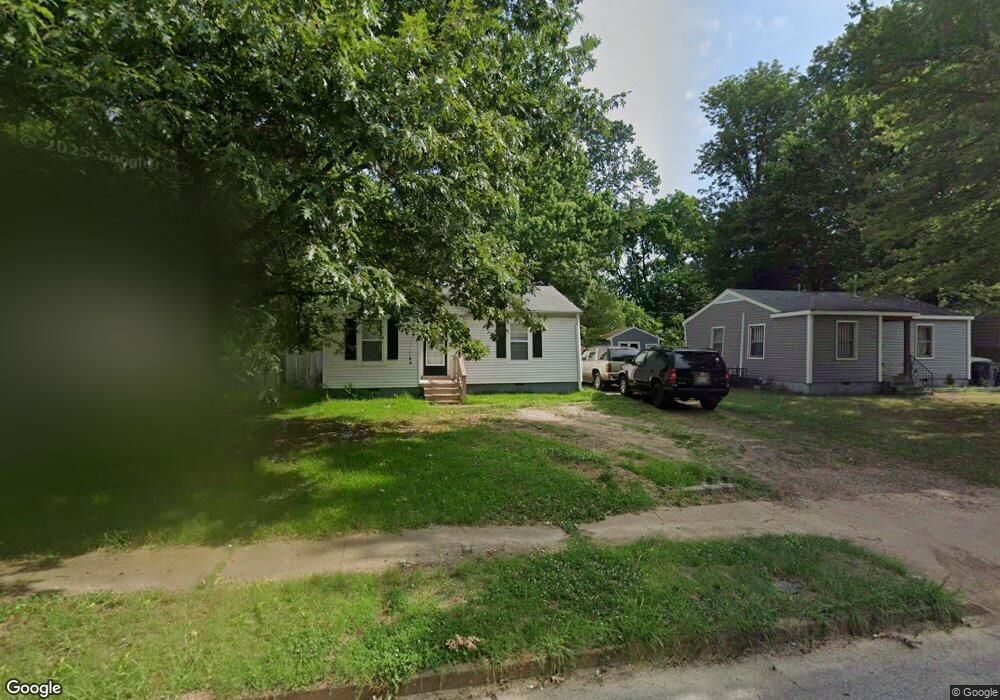
4046 Truman Ave Memphis, TN 38108
Douglass NeighborhoodEstimated Value: $117,409 - $134,000
3
Beds
2
Baths
1,431
Sq Ft
$89/Sq Ft
Est. Value
About This Home
This home is located at 4046 Truman Ave, Memphis, TN 38108 and is currently estimated at $127,102, approximately $88 per square foot. 4046 Truman Ave is a home located in Shelby County with nearby schools including Wells Station Elementary School, Kingsbury Middle School, and Kingsbury High School.
Ownership History
Date
Name
Owned For
Owner Type
Purchase Details
Closed on
Jan 16, 2025
Sold by
Kassaye Benyam
Bought by
Fairmont Enterprises Llc
Current Estimated Value
Home Financials for this Owner
Home Financials are based on the most recent Mortgage that was taken out on this home.
Original Mortgage
$96,000
Outstanding Balance
$82,148
Interest Rate
6.72%
Mortgage Type
New Conventional
Estimated Equity
$44,954
Purchase Details
Closed on
Jan 19, 2016
Sold by
Stanfield Michael
Bought by
Kassaye Benyam
Purchase Details
Closed on
Sep 28, 1998
Sold by
Ritch James E and Ritch Ama L
Bought by
Stanfield Michael
Home Financials for this Owner
Home Financials are based on the most recent Mortgage that was taken out on this home.
Original Mortgage
$55,777
Interest Rate
6.95%
Mortgage Type
FHA
Purchase Details
Closed on
Feb 19, 1996
Bought by
Adams Alice F
Create a Home Valuation Report for This Property
The Home Valuation Report is an in-depth analysis detailing your home's value as well as a comparison with similar homes in the area
Home Values in the Area
Average Home Value in this Area
Purchase History
| Date | Buyer | Sale Price | Title Company |
|---|---|---|---|
| Fairmont Enterprises Llc | $128,000 | None Listed On Document | |
| Kassaye Benyam | $14,800 | Attorney | |
| Stanfield Michael | $56,000 | -- | |
| Stanfield Michael | $56,000 | -- | |
| Adams Alice F | $40,000 | -- |
Source: Public Records
Mortgage History
| Date | Status | Borrower | Loan Amount |
|---|---|---|---|
| Open | Fairmont Enterprises Llc | $96,000 | |
| Previous Owner | Stanfield Michael | $55,777 |
Source: Public Records
Tax History
| Year | Tax Paid | Tax Assessment Tax Assessment Total Assessment is a certain percentage of the fair market value that is determined by local assessors to be the total taxable value of land and additions on the property. | Land | Improvement |
|---|---|---|---|---|
| 2025 | $425 | $24,075 | $3,975 | $20,100 |
| 2024 | $425 | $12,525 | $1,500 | $11,025 |
| 2023 | $763 | $12,525 | $1,500 | $11,025 |
| 2022 | $763 | $12,525 | $1,500 | $11,025 |
| 2021 | $772 | $12,525 | $1,500 | $11,025 |
| 2020 | $786 | $10,850 | $1,500 | $9,350 |
| 2019 | $786 | $10,850 | $1,500 | $9,350 |
| 2018 | $786 | $10,850 | $1,500 | $9,350 |
| 2017 | $446 | $10,850 | $1,500 | $9,350 |
| 2016 | $558 | $12,775 | $0 | $0 |
| 2014 | $558 | $12,775 | $0 | $0 |
Source: Public Records
Map
Nearby Homes
- 4039 Westover Ave
- 3997 Truman Ave
- 4113 Truman Ave
- 1493 Luverne St
- 4058 Ward Ave
- 1641 N Graham St
- 4117 Grey Rd
- 1658 Sailors St
- 1662 Sailors St
- 4064 Reed Ave
- 1543 Stacey St
- 1674 Sailors St
- 1481 Stacey St
- 4161 Grey Rd
- 1664 Helsley Rd
- 1710 Mcnair St
- 4202 Reed Ave
- 3901 Grey Rd
- 4248 Truman Ave
- 3954 Berkshire Ave
- 4040 Truman Ave
- 4052 Truman Ave
- 4034 Truman Ave
- 4058 Truman Ave
- 4049 Print Ave
- 4043 Print Ave
- 4055 Print Ave
- 4035 Print Ave
- 4061 Print Ave
- 4047 Truman Ave
- 4028 Truman Ave
- 4064 Truman Ave
- 4053 Truman Ave
- 4041 Truman Ave
- 4031 Print Ave
- 4059 Truman Ave
- 4035 Truman Ave
- 4063 Print Ave
- 4022 Truman Ave
- 4070 Truman Ave
Your Personal Tour Guide
Ask me questions while you tour the home.