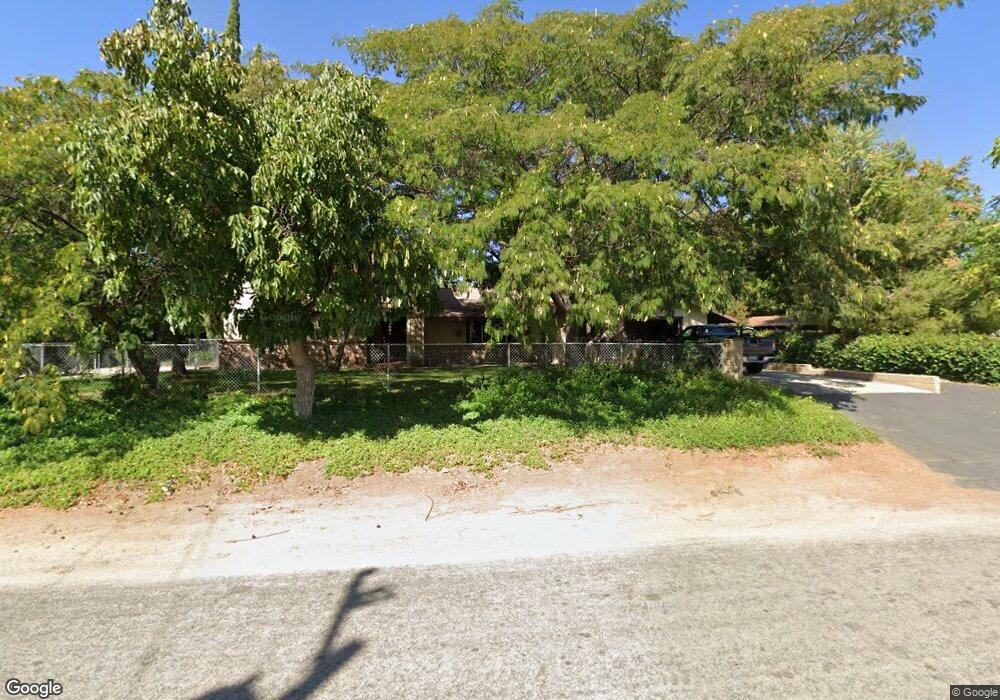
40462 Dutton St Cherry Valley, CA 92223
Estimated Value: $646,669 - $863,000
5
Beds
2
Baths
3,887
Sq Ft
$195/Sq Ft
Est. Value
About This Home
This home is located at 40462 Dutton St, Cherry Valley, CA 92223 and is currently estimated at $758,417, approximately $195 per square foot. 40462 Dutton St is a home located in Riverside County with nearby schools including Brookside Elementary School, Mountain View Middle School, and Beaumont Senior High School.
Ownership History
Date
Name
Owned For
Owner Type
Purchase Details
Closed on
Aug 14, 2017
Sold by
Hartzler Franklin R
Bought by
Hartzler Franklin R and The Franklin R Harzler Family Trust
Current Estimated Value
Purchase Details
Closed on
Jun 13, 2012
Sold by
Hartzler Frank R
Bought by
Hartzler Fanklin R
Home Financials for this Owner
Home Financials are based on the most recent Mortgage that was taken out on this home.
Original Mortgage
$100,000
Interest Rate
3.74%
Mortgage Type
New Conventional
Purchase Details
Closed on
May 6, 2002
Sold by
Goad Barbara Hirter
Bought by
Goad David C
Purchase Details
Closed on
Nov 6, 1995
Sold by
Small Kenneth R and Small Jan
Bought by
Goad Barbara Hirter and Allison Leisa R
Home Financials for this Owner
Home Financials are based on the most recent Mortgage that was taken out on this home.
Original Mortgage
$48,000
Interest Rate
7.42%
Mortgage Type
Seller Take Back
Create a Home Valuation Report for This Property
The Home Valuation Report is an in-depth analysis detailing your home's value as well as a comparison with similar homes in the area
Home Values in the Area
Average Home Value in this Area
Purchase History
| Date | Buyer | Sale Price | Title Company |
|---|---|---|---|
| Hartzler Franklin R | -- | None Available | |
| Hartzler Fanklin R | -- | None Available | |
| Goad David C | -- | -- | |
| Goad Barbara Hirter | $60,000 | Northern Counties Title Ins |
Source: Public Records
Mortgage History
| Date | Status | Borrower | Loan Amount |
|---|---|---|---|
| Closed | Hartzler Fanklin R | $100,000 | |
| Closed | Goad Barbara Hirter | $48,000 |
Source: Public Records
Tax History
| Year | Tax Paid | Tax Assessment Tax Assessment Total Assessment is a certain percentage of the fair market value that is determined by local assessors to be the total taxable value of land and additions on the property. | Land | Improvement |
|---|---|---|---|---|
| 2025 | $2,527 | $200,800 | $48,588 | $152,212 |
| 2023 | $2,527 | $193,004 | $46,702 | $146,302 |
| 2022 | $2,485 | $189,221 | $45,787 | $143,434 |
| 2021 | $2,437 | $185,512 | $44,890 | $140,622 |
| 2020 | $2,410 | $183,611 | $44,430 | $139,181 |
| 2019 | $2,370 | $180,011 | $43,559 | $136,452 |
| 2018 | $2,359 | $176,482 | $42,705 | $133,777 |
| 2017 | $2,320 | $173,022 | $41,868 | $131,154 |
| 2016 | $2,257 | $169,631 | $41,048 | $128,583 |
| 2015 | $2,218 | $167,085 | $40,433 | $126,652 |
| 2014 | $2,218 | $163,814 | $39,642 | $124,172 |
Source: Public Records
Map
Nearby Homes
- 40587 Dutton St
- 40587 High St
- 10165 Frontier Trail
- 10002 Frontier Trail
- 40795 Laredo Trail
- 40848 Laredo Trail
- 10123 Pawnee Cir
- 40896 Oregon Trail
- 10435 Frontier Trail
- 10475 Frontier Trail
- 10500 Frontier Trail
- 10145 Chisholm Trail
- 40975 Laredo Trail
- 41004 Cheyenne Trail
- 10203 Overland Trail
- 41238 Cheyenne Trail
- 10322 Chisholm Trail
- 10650 Bel Air Dr
- 10420 Chisholm Trail
- 10751 Deerfield Dr
- 40494 Dutton St
- 40430 Dutton St
- 10165 Winesap Ave
- 40534 Dutton St
- 10080 Winesap Ave
- 10185 Winesap Ave
- 40418 Dutton St
- 40554 Dutton St
- 40591 Dutton St
- 40372 Dutton St
- 10033 Winesap Ave
- 10003 Winesap Ave
- 40381 Dutton St
- 40590 Dutton St
- 10254 Winesap Ave
- 10050 Woodchuck Cir
- 40472 Orchard Place
- 40626 Dutton St
- 40414 Orchard Place
- 40345 Dutton St
Your Personal Tour Guide
Ask me questions while you tour the home.