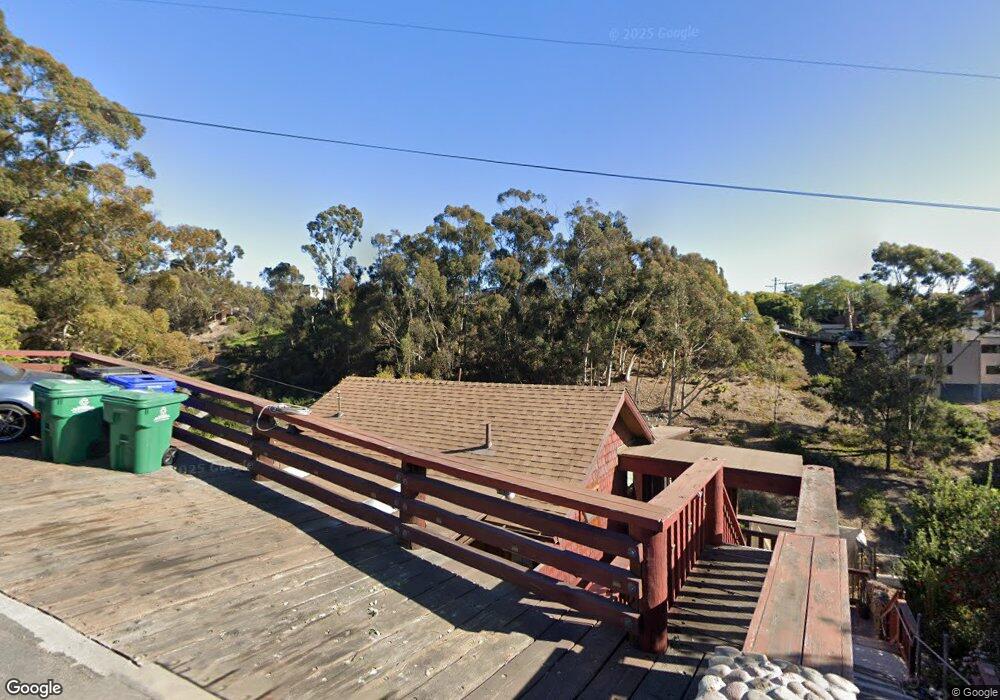
4047 Bay View Ct San Diego, CA 92103
Mission Hills NeighborhoodEstimated Value: $1,885,000 - $2,479,000
2
Beds
2
Baths
1,754
Sq Ft
$1,177/Sq Ft
Est. Value
About This Home
This home is located at 4047 Bay View Ct, San Diego, CA 92103 and is currently estimated at $2,064,240, approximately $1,176 per square foot. 4047 Bay View Ct is a home located in San Diego County with nearby schools including Grant K-8, Richard Henry Dana Middle School, and Roosevelt International Middle School.
Ownership History
Date
Name
Owned For
Owner Type
Purchase Details
Closed on
Jun 22, 2016
Sold by
Schneider Richard Jeffrey
Bought by
Schneider Richard J
Current Estimated Value
Purchase Details
Closed on
Jun 17, 2014
Sold by
Vannorman James and Van Norman Marsha
Bought by
Schneider Richard Jeffrey
Home Financials for this Owner
Home Financials are based on the most recent Mortgage that was taken out on this home.
Original Mortgage
$203,750
Outstanding Balance
$155,197
Interest Rate
4.16%
Mortgage Type
Credit Line Revolving
Estimated Equity
$1,909,043
Purchase Details
Closed on
Apr 4, 2013
Sold by
Vannorman James Allen and Van Norman Marsha
Bought by
Vannorman James and Van Norman Marsha
Purchase Details
Closed on
Mar 26, 2013
Sold by
Vannorman Gloria A and Wilkes Gloria A
Bought by
Vannorman James Allen
Purchase Details
Closed on
Aug 4, 1999
Sold by
Darling Helen A
Bought by
Vannorman Ellen and Vannorman Helen Darling
Create a Home Valuation Report for This Property
The Home Valuation Report is an in-depth analysis detailing your home's value as well as a comparison with similar homes in the area
Home Values in the Area
Average Home Value in this Area
Purchase History
| Date | Buyer | Sale Price | Title Company |
|---|---|---|---|
| Schneider Richard J | -- | None Available | |
| Schneider Richard Jeffrey | $865,000 | Chicago Title Company | |
| Vannorman James | -- | None Available | |
| Vannorman James Allen | -- | None Available | |
| Vannorman James Allen | $70,000 | None Available | |
| Vannorman Ellen | -- | -- |
Source: Public Records
Mortgage History
| Date | Status | Borrower | Loan Amount |
|---|---|---|---|
| Open | Schneider Richard Jeffrey | $203,750 | |
| Open | Schneider Richard Jeffrey | $546,250 |
Source: Public Records
Tax History Compared to Growth
Tax History
| Year | Tax Paid | Tax Assessment Tax Assessment Total Assessment is a certain percentage of the fair market value that is determined by local assessors to be the total taxable value of land and additions on the property. | Land | Improvement |
|---|---|---|---|---|
| 2025 | $12,466 | $1,039,594 | $769,182 | $270,412 |
| 2024 | $12,466 | $1,019,210 | $754,100 | $265,110 |
| 2023 | $12,189 | $999,226 | $739,314 | $259,912 |
| 2022 | $11,864 | $979,634 | $724,818 | $254,816 |
| 2021 | $11,781 | $960,426 | $710,606 | $249,820 |
| 2020 | $11,637 | $950,579 | $703,320 | $247,259 |
| 2019 | $11,428 | $931,941 | $689,530 | $242,411 |
| 2018 | $10,682 | $913,668 | $676,010 | $237,658 |
| 2017 | $10,427 | $895,754 | $662,755 | $232,999 |
| 2016 | $10,260 | $878,191 | $649,760 | $228,431 |
| 2015 | $10,107 | $865,000 | $640,000 | $225,000 |
| 2014 | $969 | $79,621 | $28,056 | $51,565 |
Source: Public Records
Map
Nearby Homes
- 3770 Keating St
- 1864 Sunset Blvd
- 1753 W Lewis St
- 4232 Arden Way
- 3625 Keating St Unit 4
- 1728 W Lewis St
- 1694 Torrance St
- 1695 Neale St
- 1860 W Montecito Way
- 3903 California St Unit 3
- 1806 Mckee St Unit A2
- 1806 Mckee St Unit A9
- 3519 Andrews St
- 2045 W California St
- 2120 Pine St
- 1329 Fort Stockton Dr
- 2147 Pine St
- 2111 W California St
- 3972 Jackdaw St
- 3972 Jackdaw St Unit 109
- 1853 Lyndon Rd
- 4031 Bay View Ct
- 1855 Lyndon Rd
- 1849 Lyndon Rd
- 1875 Lyndon Rd
- 1848 Lyndon Rd
- 4209-4221 W Third St
- 1840 Neale St
- 1845 Neale St
- 3933 Saint James Place
- 3911 Saint James Place
- 1841 Lyndon Rd
- 1850 Lyndon Rd
- 3955 Saint James Place
- 1877 Lyndon Rd
- 1834 Torrance St
- 3939 Saint James Place
- 1833 Neale St
- 3985 Clark St
- 1852 Washington Place