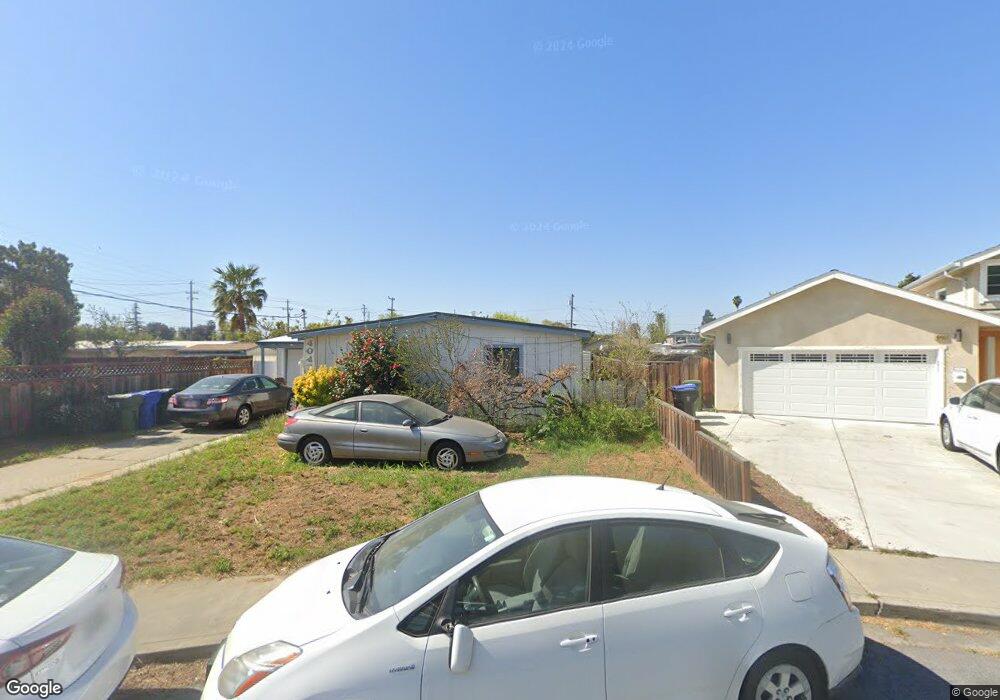
40471 Eaton Ct Fremont, CA 94538
Downtown Fremont NeighborhoodEstimated Value: $1,023,000 - $1,228,000
3
Beds
1
Bath
950
Sq Ft
$1,211/Sq Ft
Est. Value
About This Home
This home is located at 40471 Eaton Ct, Fremont, CA 94538 and is currently estimated at $1,150,126, approximately $1,210 per square foot. 40471 Eaton Ct is a home located in Alameda County with nearby schools including J. Haley Durham Elementary School, G.M. Walters Middle School, and John F. Kennedy High School.
Ownership History
Date
Name
Owned For
Owner Type
Purchase Details
Closed on
Sep 4, 2015
Sold by
Matthews Kevin and Matthews Viki
Bought by
Matthews Viki and Matthews Victoria
Current Estimated Value
Purchase Details
Closed on
May 20, 2005
Sold by
Matthews Viki and Matthews Kevin
Bought by
Matthews Kevin R and Matthews Viki
Home Financials for this Owner
Home Financials are based on the most recent Mortgage that was taken out on this home.
Original Mortgage
$350,000
Outstanding Balance
$173,982
Interest Rate
5.12%
Mortgage Type
Purchase Money Mortgage
Estimated Equity
$976,144
Purchase Details
Closed on
Jun 23, 1998
Sold by
Miller Scott A and Miller Stacy
Bought by
Matthews Kevin and Matthews Viki
Home Financials for this Owner
Home Financials are based on the most recent Mortgage that was taken out on this home.
Original Mortgage
$194,750
Interest Rate
7.17%
Purchase Details
Closed on
May 10, 1994
Sold by
Woods Sally
Bought by
Miller Scott A
Create a Home Valuation Report for This Property
The Home Valuation Report is an in-depth analysis detailing your home's value as well as a comparison with similar homes in the area
Home Values in the Area
Average Home Value in this Area
Purchase History
| Date | Buyer | Sale Price | Title Company |
|---|---|---|---|
| Matthews Viki | -- | None Available | |
| Matthews Kevin R | -- | Old Republic Title Company | |
| Matthews Kevin | $205,000 | American Title Co | |
| Miller Scott A | -- | -- |
Source: Public Records
Mortgage History
| Date | Status | Borrower | Loan Amount |
|---|---|---|---|
| Open | Matthews Kevin R | $350,000 | |
| Closed | Matthews Kevin | $194,750 |
Source: Public Records
Tax History
| Year | Tax Paid | Tax Assessment Tax Assessment Total Assessment is a certain percentage of the fair market value that is determined by local assessors to be the total taxable value of land and additions on the property. | Land | Improvement |
|---|---|---|---|---|
| 2025 | $4,527 | $333,275 | $98,195 | $242,080 |
| 2024 | $4,527 | $326,604 | $96,270 | $237,334 |
| 2023 | $4,391 | $327,063 | $94,382 | $232,681 |
| 2022 | $4,314 | $313,651 | $92,532 | $228,119 |
| 2021 | $4,212 | $307,364 | $90,718 | $223,646 |
| 2020 | $4,160 | $311,142 | $89,788 | $221,354 |
| 2019 | $4,115 | $305,042 | $88,028 | $217,014 |
| 2018 | $4,031 | $299,062 | $86,302 | $212,760 |
| 2017 | $3,930 | $293,199 | $84,610 | $208,589 |
| 2016 | $3,853 | $287,451 | $82,951 | $204,500 |
| 2015 | $3,791 | $283,133 | $81,705 | $201,428 |
| 2014 | $3,718 | $277,588 | $80,105 | $197,483 |
Source: Public Records
Map
Nearby Homes
- 40300 Grimmer Blvd
- 3861 Cosmic Place
- 40775 Max Dr
- 40753 Squill Common
- 40425 Chapel Way Unit 309
- 40425 Chapel Way Unit 101
- 40857 Lincoln St Unit 3705
- 40857 Lincoln St Unit 3701
- 40071 Leslie St
- 40489 Davis St
- 40272 Davis St
- 4310 Providence Terrace
- 3300 Wolcott Common Unit 113
- 40871 High St
- 3909 Stevenson Blvd Unit 402
- 4463 Hyde Common Unit 116
- 4412 Millard Ave
- 3323 Union St
- 39902 Fremont Blvd
- 2767 Pismo Terrace
- 40463 Eaton Ct
- 3735 Eugene St
- 3723 Eugene St
- 40444 Citrus Dr
- 40460 Citrus Dr
- 40436 Citrus Dr
- 40468 Citrus Dr
- 40458 Eaton Ct
- 40482 Eaton Ct
- 40428 Citrus Dr
- 40466 Eaton Ct
- 40490 Eaton Ct
- 40474 Eaton Ct
- 40420 Citrus Dr
- 40412 Citrus Dr
- 3597 Eugene St
- 3656 Eugene St
- 3738 Eugene St
- 3644 Eugene St
- 40449 Citrus Dr
Your Personal Tour Guide
Ask me questions while you tour the home.