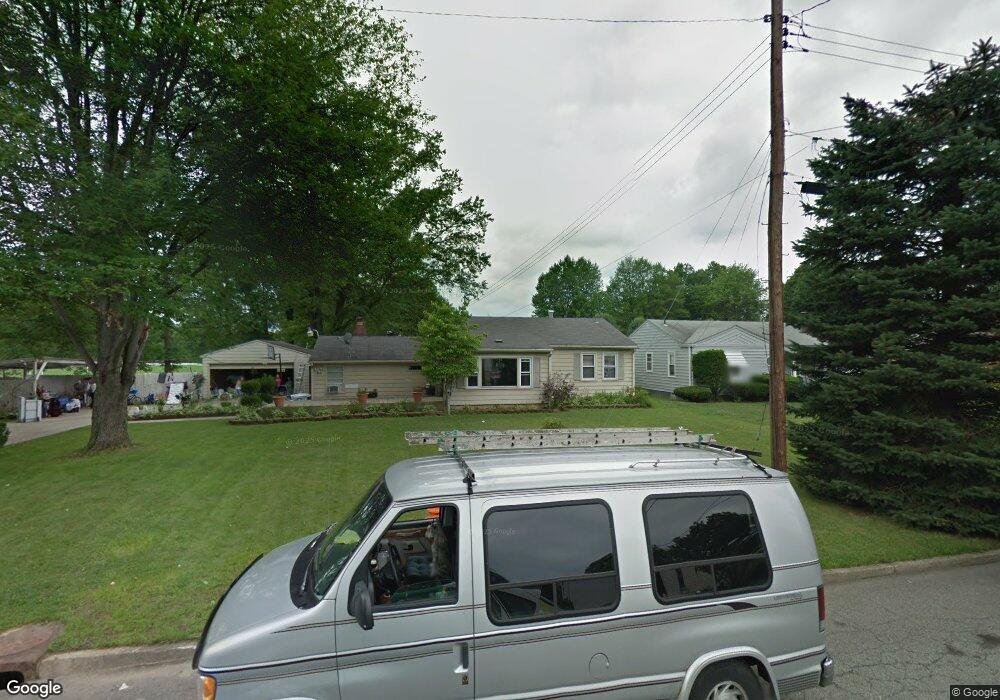
4048 Cascade Dr Youngstown, OH 44511
Estimated Value: $140,000 - $169,000
2
Beds
1
Bath
1,352
Sq Ft
$114/Sq Ft
Est. Value
About This Home
This home is located at 4048 Cascade Dr, Youngstown, OH 44511 and is currently estimated at $154,314, approximately $114 per square foot. 4048 Cascade Dr is a home located in Mahoning County with nearby schools including West Boulevard Elementary School, Boardman Center Middle School, and Boardman High School.
Ownership History
Date
Name
Owned For
Owner Type
Purchase Details
Closed on
Jan 5, 2021
Sold by
Ali Nebal and Ali Nebal M
Bought by
Ali Amead
Current Estimated Value
Purchase Details
Closed on
Dec 22, 2020
Sold by
Ali Emad
Bought by
Peewee Properties Llc
Purchase Details
Closed on
May 11, 2015
Sold by
Ali Nebal
Bought by
Ali Emad
Purchase Details
Closed on
Jul 7, 2003
Sold by
Zeyad Ali and Zeyad Kahajed M
Bought by
Ali Emad M and Ali Nebal M
Purchase Details
Closed on
Sep 16, 1996
Sold by
Seminara Rocco A
Bought by
Ali Zeyad
Home Financials for this Owner
Home Financials are based on the most recent Mortgage that was taken out on this home.
Original Mortgage
$58,560
Interest Rate
8.29%
Mortgage Type
New Conventional
Purchase Details
Closed on
Apr 26, 1990
Bought by
Seminara Rocco A and S E
Create a Home Valuation Report for This Property
The Home Valuation Report is an in-depth analysis detailing your home's value as well as a comparison with similar homes in the area
Home Values in the Area
Average Home Value in this Area
Purchase History
| Date | Buyer | Sale Price | Title Company |
|---|---|---|---|
| Ali Amead | -- | None Available | |
| Peewee Properties Llc | -- | None Available | |
| Ali Emad | -- | Attorney | |
| Ali Emad M | -- | -- | |
| Ali Zeyad | $69,000 | -- | |
| Seminara Rocco A | $49,500 | -- |
Source: Public Records
Mortgage History
| Date | Status | Borrower | Loan Amount |
|---|---|---|---|
| Previous Owner | Ali Zeyad | $58,560 |
Source: Public Records
Tax History
| Year | Tax Paid | Tax Assessment Tax Assessment Total Assessment is a certain percentage of the fair market value that is determined by local assessors to be the total taxable value of land and additions on the property. | Land | Improvement |
|---|---|---|---|---|
| 2025 | $2,389 | $47,030 | $5,850 | $41,180 |
| 2024 | $2,445 | $47,030 | $5,850 | $41,180 |
| 2023 | $2,413 | $47,030 | $5,850 | $41,180 |
| 2022 | $1,783 | $26,440 | $5,990 | $20,450 |
| 2021 | $1,744 | $26,440 | $5,990 | $20,450 |
| 2020 | $1,753 | $26,440 | $5,990 | $20,450 |
| 2019 | $1,557 | $20,660 | $4,680 | $15,980 |
| 2018 | $1,270 | $20,660 | $4,680 | $15,980 |
| 2017 | $1,267 | $20,000 | $4,680 | $15,320 |
| 2016 | $1,640 | $25,640 | $6,200 | $19,440 |
| 2015 | $1,607 | $25,640 | $6,200 | $19,440 |
| 2014 | $1,612 | $25,640 | $6,200 | $19,440 |
| 2013 | $1,591 | $25,640 | $6,200 | $19,440 |
Source: Public Records
Map
Nearby Homes
- 3930 Risher Rd
- 3911 Arden Blvd
- 4013 Hopkins Rd
- 4061 Riverside Dr
- 3731 Hopkins Rd
- 3560 Arden Blvd
- 3448 Risher Rd
- 1038 Zander Dr
- 3435 Hopkins Rd
- 57 Gillian Ln
- 2002 Canfield Rd
- 85 Lake Shore Dr
- 91 Lakeshore Dr
- 21.19 acres Truesdale and Lockwood Rd
- 3309 Bears Den Rd
- 3296 Cricket Dr
- 970 Bonnie Brae Ave
- 966 Bonnie Brae Ave
- 5025 Lockwood Blvd
- 950 Bonnie Brae Ave
- 4042 Cascade Dr
- 4065 Stratmore Ave
- 4059 Stratmore Ave
- 4047 Cascade Dr
- 4043 Stratmore Ave
- 4041 Cascade Dr
- 4030 Cascade Dr
- 4035 Cascade Dr
- 4037 Stratmore Ave
- 4031 Stratmore Ave
- 4024 Cascade Dr
- 4029 Cascade Dr
- 4048 Shelby Rd
- 4064 Stratmore Ave
- 4056 Stratmore Ave
- 4104 Shelby Rd
- 4025 Stratmore Ave
- 4050 Stratmore Ave
- 4044 Shelby Rd
- 4044 Stratmore Ave
Your Personal Tour Guide
Ask me questions while you tour the home.