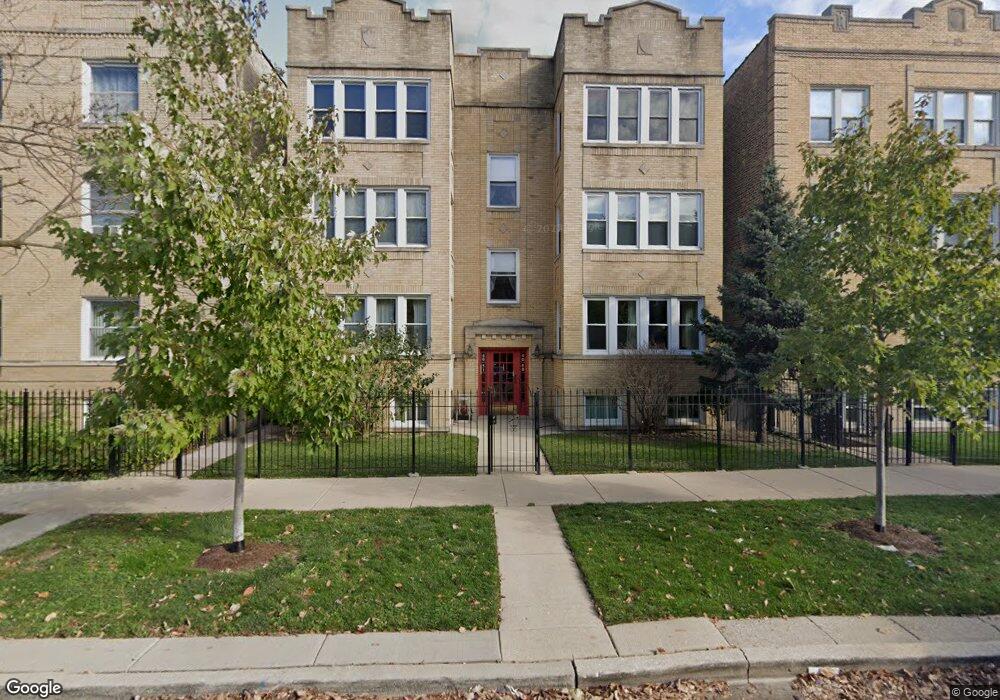
4049 N Mozart St Unit 2S Chicago, IL 60618
Irving Park NeighborhoodEstimated Value: $284,390 - $380,000
2
Beds
1
Bath
1,350
Sq Ft
$240/Sq Ft
Est. Value
About This Home
This home is located at 4049 N Mozart St Unit 2S, Chicago, IL 60618 and is currently estimated at $324,598, approximately $240 per square foot. 4049 N Mozart St Unit 2S is a home located in Cook County with nearby schools including Bateman Elementary School, Roosevelt High School, and CICS Irving Park.
Ownership History
Date
Name
Owned For
Owner Type
Purchase Details
Closed on
Feb 28, 2018
Sold by
Yaccino Kelley
Bought by
Shaffer Lucas and Salisbury Suzanne Mackenzie
Current Estimated Value
Home Financials for this Owner
Home Financials are based on the most recent Mortgage that was taken out on this home.
Original Mortgage
$188,000
Outstanding Balance
$161,063
Interest Rate
4.37%
Mortgage Type
New Conventional
Estimated Equity
$163,535
Purchase Details
Closed on
May 1, 2007
Sold by
Weber Ahnna
Bought by
Yaccino Kelley
Home Financials for this Owner
Home Financials are based on the most recent Mortgage that was taken out on this home.
Original Mortgage
$180,000
Interest Rate
6.2%
Mortgage Type
Unknown
Purchase Details
Closed on
Aug 29, 2001
Sold by
Engel Thomas and Engel Susan Hope
Bought by
Weber Ahnna
Home Financials for this Owner
Home Financials are based on the most recent Mortgage that was taken out on this home.
Original Mortgage
$181,550
Interest Rate
6.97%
Create a Home Valuation Report for This Property
The Home Valuation Report is an in-depth analysis detailing your home's value as well as a comparison with similar homes in the area
Home Values in the Area
Average Home Value in this Area
Purchase History
| Date | Buyer | Sale Price | Title Company |
|---|---|---|---|
| Shaffer Lucas | $235,000 | Fidelity National Title | |
| Yaccino Kelley | $225,000 | First American Title | |
| Weber Ahnna | $187,500 | -- |
Source: Public Records
Mortgage History
| Date | Status | Borrower | Loan Amount |
|---|---|---|---|
| Open | Shaffer Lucas | $188,000 | |
| Previous Owner | Yaccino Kelley | $180,000 | |
| Previous Owner | Weber Ahnna | $181,550 |
Source: Public Records
Tax History Compared to Growth
Tax History
| Year | Tax Paid | Tax Assessment Tax Assessment Total Assessment is a certain percentage of the fair market value that is determined by local assessors to be the total taxable value of land and additions on the property. | Land | Improvement |
|---|---|---|---|---|
| 2024 | $3,956 | $24,004 | $5,890 | $18,114 |
| 2023 | $3,835 | $22,000 | $4,750 | $17,250 |
| 2022 | $3,835 | $22,000 | $4,750 | $17,250 |
| 2021 | $3,766 | $21,999 | $4,750 | $17,249 |
| 2020 | $3,797 | $20,087 | $2,090 | $17,997 |
| 2019 | $3,817 | $22,366 | $2,090 | $20,276 |
| 2018 | $3,976 | $23,499 | $2,090 | $21,409 |
| 2017 | $3,335 | $18,818 | $1,900 | $16,918 |
| 2016 | $3,280 | $18,818 | $1,900 | $16,918 |
| 2015 | $2,978 | $18,818 | $1,900 | $16,918 |
| 2014 | $3,285 | $20,209 | $1,710 | $18,499 |
| 2013 | $3,209 | $20,209 | $1,710 | $18,499 |
Source: Public Records
Map
Nearby Homes
- 4020 N Francisco Ave
- 2714 W Byron St
- 3929 N Francisco Ave
- 3908 N Mozart St
- 4251 N Mozart St Unit 2S
- 4251 N Mozart St Unit S2
- 3835 N Francisco Ave
- 3024 W Irving Park Rd Unit 1S
- 3042 W Irving Park Rd
- 4015 N Albany Ave
- 4018 N Albany Ave Unit GB
- 4027 N Troy St
- 4347 N Richmond St Unit 1N
- 4347 N Richmond St Unit 1S
- 4347 N Richmond St Unit 3N
- 4347 N Richmond St Unit 2N
- 3102 W Berteau Ave Unit 31023
- 2468 W Berteau Ave
- 4343 N Sacramento Ave Unit A-G
- 3716 N Richmond St
- 4049 N Mozart St Unit 3S
- 4049 N Mozart St Unit 1S
- 4049 N Mozart St Unit 3S
- 4051 N Mozart St Unit 1N
- 4049 N Mozart St Unit P1
- 4049 N Mozart St Unit 3N
- 4049 N Mozart St Unit 2N
- 4049 N Mozart St Unit P2
- 4049 N Mozart St Unit P3
- 4049 N Mozart St Unit P4
- 4049 N Mozart St Unit 3E
- 4051 N Mozart St Unit 2N
- 4049 N Mozart St Unit 1
- 4051 N Mozart St Unit 3N
- 4047 N Mozart St Unit 2W
- 4055 Mozart
- 4043 N Mozart St Unit 47
- 4043 N Mozart St Unit 45.5-3W
- 4043 N Mozart St Unit 47-2W
- 4043 N Mozart St Unit 45.5-2W